Dogecoin (DOGE) is currently attempting to find a local bottom after a prolonged correction phase. Trading around $0.093, the asset is showing signs of a potential relief bounce, though the broader structure remains heavily weighed down by overhead resistance levels.
. . .
Technical Breakdown
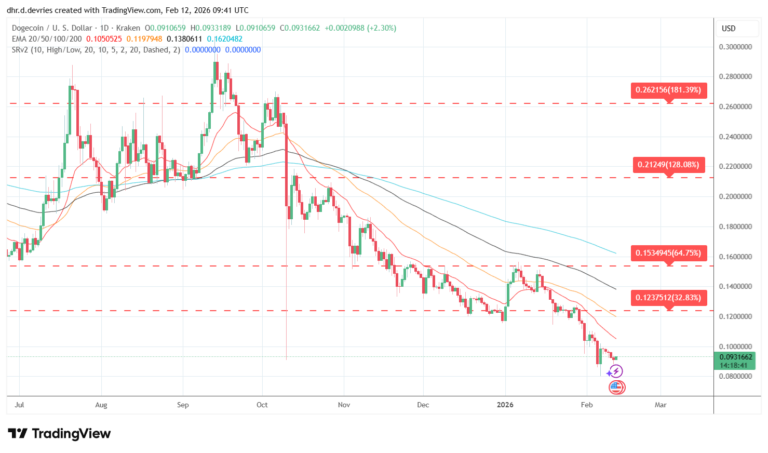
The daily chart illustrates a clear downtrend, with the price action confined below all major Exponential Moving Averages (EMAs). The bearish fan formation of the EMAs suggests that selling pressure has been dominant for several weeks.
- EMA 20 (Red): Located approximately at $0.105, this line acts as the immediate dynamic resistance. The price is currently reacting to this level, and a rejection here would confirm the continuation of short-term bearish momentum.
- EMA 50 & 100 (Yellow/Black): Hovering around $0.119 and $0.138 respectively, these lines represent the medium-term trend. The widening gap between them indicates that the downtrend has established significant strength.
- EMA 200 (Blue): Sitting high at $0.162, the 200 EMA confirms the long-term trend is currently bearish. A significant reversal would be required to challenge this zone.
. . .
The Bullish Path
For a bullish reversal to gain credibility, buyers must first reclaim the EMA 20 at $0.105. Beyond that, the critical resistance level to watch is the $0.1237 zone (indicated by the red dashed line). Breaking this level would invalidate the immediate lower-high structure and could open the door for a retest of the $0.153 region.
. . .
The Bearish Path
If the current relief rally fails to break the EMA 20, the focus shifts back to support. The recent lows around the $0.080 – $0.085 mark are crucial. Losing this green support zone would likely trigger a deeper capitulation, potentially driving prices toward historical accumulation zones below $0.080.
. . .
Weekly Verdict
Dogecoin is in a precarious position; while a short-term bounce is active, the trend remains bearish unless the $0.105 resistance is decisively reclaimed.
 Stay Ahead in Crypto