English
  Nederlands
  Deutsch
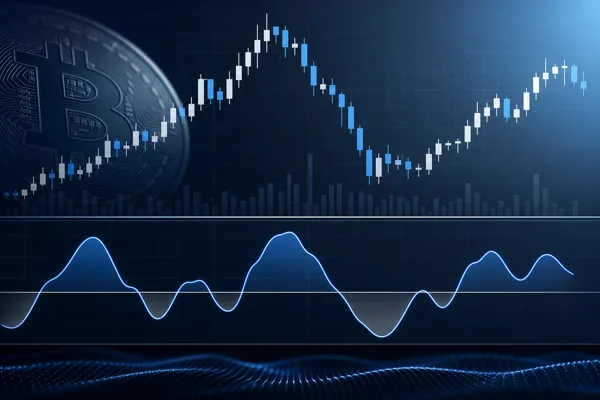
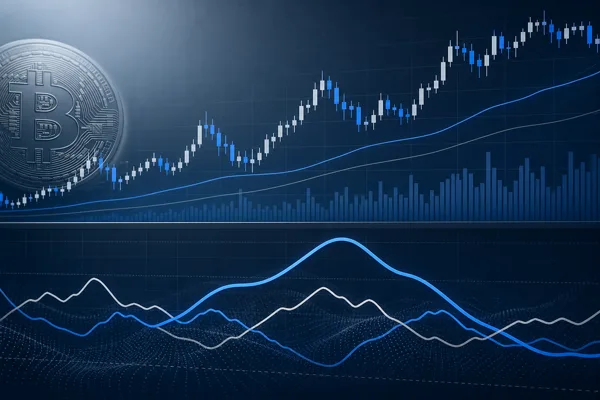
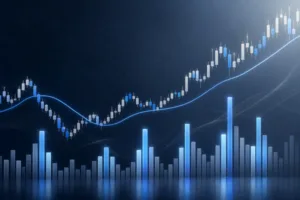
What Is VWMA (Volume-Weighted Moving Average)?
Key Takeaways The VWMA is a moving average that weights each period’s price by its trading volume, so busy, high-volume candles pull the line more...

Key Takeaways The VWMA is a moving average that weights each period’s price by its trading volume, so busy, high-volume candles pull the line more...

Key Takeaways The Simple Moving Average (SMA) is the plain average of an asset’s last N closing prices, plotted as a smooth line that reveals...
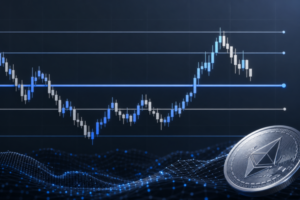
Key Takeaways Pivot points are support and resistance levels calculated from the previous period’s high, low, and close, with one central pivot (P), three resistances...
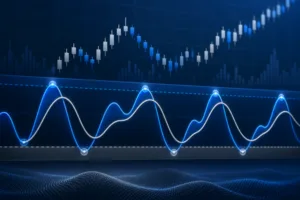
Key Takeaways Stochastic RSI applies the Stochastic formula to RSI values, making it a momentum-of-momentum oscillator that reacts faster than plain RSI. Readings above 0.8...
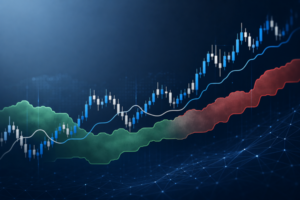
Key Takeaways The Ichimoku Cloud is an all-in-one indicator that shows trend, momentum, and support or resistance in a single view. It plots five lines...
Key Takeaways Pearson correlation is a single number from -1 to +1 that measures how closely two assets’ returns move in a straight line: +1...
How the RSI oscillator scores momentum on a 0-100 scale, flags overbought and oversold zones, and helps traders spot reversals.
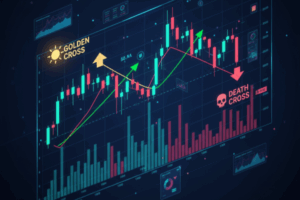
The Golden Cross and Death Cross are moving-average crossovers that flag bullish or bearish trend shifts, most reliable on daily charts with volume.
A double bottom is a bullish reversal pattern with two equal lows and a neckline breakout, signaling strong support and potential upside.

Ascending and descending triangles signal breakouts during consolidation, showing shifting buyer and seller pressure for bullish or bearish entries.