English
  Nederlands
  Deutsch
Key Takeaways
- The Simple Moving Average (SMA) is the plain average of an asset’s last N closing prices, plotted as a smooth line that reveals the underlying trend.
- The 50-day and 200-day SMAs are the most-watched periods in crypto, and their crossover defines the Golden Cross and Death Cross signals.
- The SMA is a lagging confirmation tool, best read alongside other indicators rather than used as a standalone buy or sell trigger.
In This Article
- Reading the Trend Through the Noise
- The Simple Moving Average at a Glance
- Where Moving Averages Came From
- How Is an SMA Calculated?
- The Most-Watched SMA Periods
- Why Traders Rely on the SMA
- The Limits of the Simple Moving Average
- SMA vs EMA: Which Moving Average?
- How Traders Read the SMA
- Why the SMA Still Matters in 2026
Reading the Trend Through the Noise
Crypto prices rarely move in a straight line. A single day can bring a sharp wick up, a fast sell-off, and a slow grind back, all of which make it hard to tell whether an asset is genuinely trending or just churning sideways. The Simple Moving Average exists to answer one question: stripped of the daily noise, which way is price actually heading?
It is one of the oldest and most widely used tools in technical analysis, and for good reason. It takes a messy price chart and draws a single smooth line through it, giving traders a clean reference for trend direction, support, and resistance.
The Simple Moving Average at a Glance
A Simple Moving Average is the arithmetic mean of an asset’s closing prices over a fixed number of recent periods. You pick a window, say the last 20 days, add up those closes, and divide by 20. That single number is one point on the SMA line, and repeating it for every day produces the continuous curve overlaid on price charts.
The word that matters most is “moving.” Each new period, the latest close enters the calculation and the oldest one drops out, so the average rolls forward in step with the market, tracking price more slowly and smoothly than price itself. One defining trait sets it apart from its cousins: every price inside the window carries equal weight, so yesterday’s close counts exactly as much as a close from 20 days ago. That simplicity is both its strength and, as we will see, its main weakness.
Where Moving Averages Came From
The moving average began life as a statistical technique, not a trading tool. Its mathematical form is usually dated to around 1901, when it was used to smooth noisy data in fields like meteorology and economics. The exact origin is genuinely murky, so it is fairer to call it a tool that evolved than one that was invented on a single date.
Its move into financial markets is conventionally credited to Charles Dow, the early-1900s journalist often called the father of technical analysis, though sources disagree on who first applied it to price charts. By the 1950s and 1960s, moving averages had become a standard part of the professional trader’s toolkit, and that era’s experiments with faster, weighted variants eventually produced the Exponential Moving Average.
How Is an SMA Calculated?
The formula is refreshingly plain. Add up the last N closing prices and divide by N. If the last five daily closes were 100, 102, 101, 104, and 103, the 5-day SMA is 510 divided by 5, which equals 102.
The Rolling Window
The calculation repeats each period using a sliding window. When tomorrow’s close arrives, it joins the set and the oldest price leaves it, so you are always averaging the most recent N prices. Plotting each result in sequence produces the smooth line. Because an old price exiting the window can shift the average even when today’s price barely moves, the SMA sometimes turns for reasons that have more to do with the past than the present.
Choosing the Period (N)
The window length changes everything. A short window like 10 or 20 hugs price closely and reacts quickly, which suits short-term trading, while a long window like 200 produces a slow, stable line that reflects the big-picture trend. The same SMA can also be applied to any timeframe, so a 200-day SMA on a daily chart and a 200-week SMA on a weekly chart are two very different indicators.
The Most-Watched SMA Periods
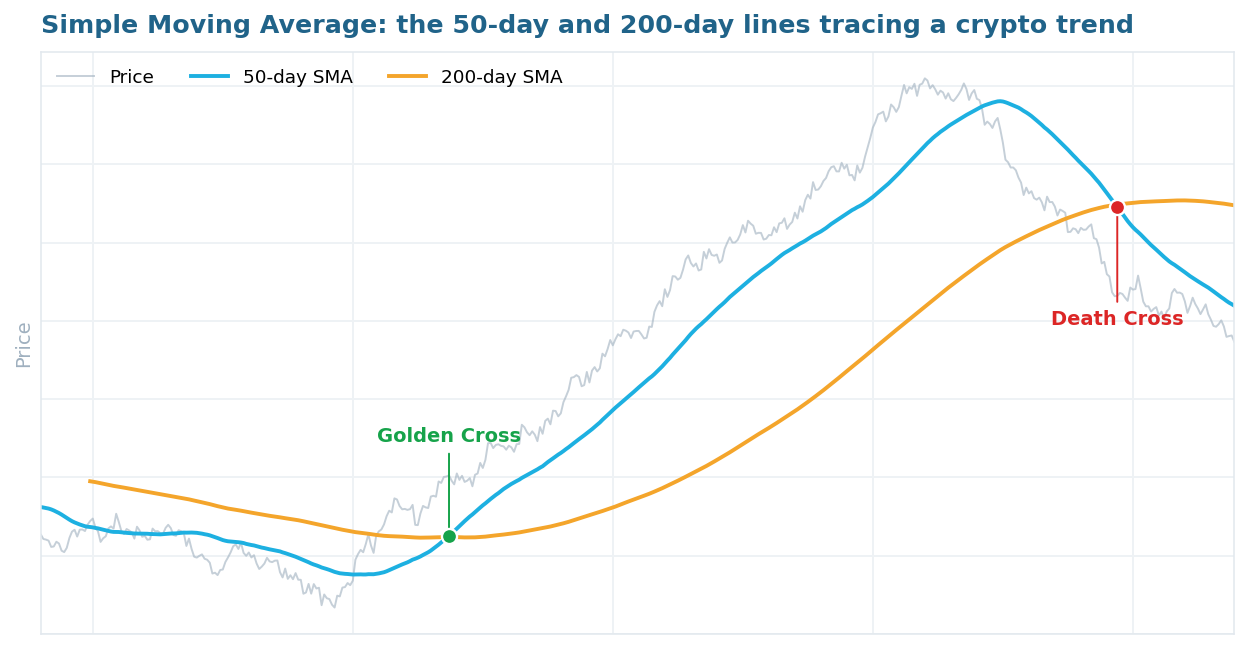
A handful of periods have become conventions that traders watch closely, partly because so many people act on them. The 20-period SMA tracks short-term momentum, the 50-period captures the intermediate trend, and the 200-period is the benchmark for the long-term trend. On a daily chart, 200 trading days is roughly a year, which is why the 200-day SMA is the single most institutionally watched moving average in both stocks and crypto.
The 50-day and 200-day lines also produce the two most famous moving-average signals. When the 50-day SMA crosses above the 200-day, traders call it a Golden Cross, read as a shift toward a long-term uptrend. When the 50-day falls below the 200-day, it is a Death Cross, read as a turn toward a downtrend. Both are widely followed, but both are lagging by nature: a Death Cross often prints only after a large part of a decline has already happened, so they confirm trends more than they predict them.
Why Traders Rely on the SMA
- Simple and transparent: the math is just an average, with no hidden weighting, and every charting platform supports it.
- Cuts through noise: it smooths volatile crypto price action into a clear, readable trend direction.
- Fewer false signals: because it reacts slowly, it produces fewer whipsaws than faster averages when confirming an established trend.
- Objective and rules-based: “price above the line is bullish, below is bearish” gives a mechanical reference that removes emotion.
- Acts as dynamic support and resistance: heavily watched lines like the 200-day often become real levels where price bounces or stalls.
The Limits of the Simple Moving Average
- Lag is built in: the SMA is made entirely of past prices, so it confirms a trend only after it is already underway.
- Whipsaws in sideways markets: when price chops back and forth across the line, the SMA fires frequent false signals.
- Equal weighting dulls reaction: a stale price from N periods ago counts as much as today’s close, which slows the response to sudden moves.
- No predictive power alone: it describes what price has done, not what news, regulation, or macro catalysts will do next.
- Sensitive to window choice: a 20-day and a 200-day SMA can point in opposite directions on the same chart.
SMA vs EMA: Which Moving Average?
The Simple Moving Average’s main rival is the Exponential Moving Average (EMA). The difference comes down to weighting. The SMA treats every price in the window equally, while the EMA gives more weight to recent prices so it reacts faster to new moves. That responsiveness is exactly why momentum indicators like MACD are built from EMAs rather than SMAs.
| Factor | SMA | EMA |
|---|---|---|
| Weighting | Equal across all periods | More weight to recent prices |
| Lag | More lag, slower to turn | Less lag, quicker to react |
| Signals | Fewer false signals | More noise and whipsaws |
| Best for | Long-term trend confirmation | Short-term, active trading |
Neither is better in absolute terms. Short-term traders often prefer the EMA for earlier entries, while longer-term investors lean on the SMA for stable trend confirmation and major support levels. Both remain lagging indicators built on past data, and at very long windows their behavior converges, so the choice matters less the further out you look.
How Traders Read the SMA
In practice, traders use the SMA in a few consistent ways. The most basic is trend direction: price holding above a rising SMA signals a healthy uptrend, while price below a falling SMA signals weakness. A flat line warns that the market is ranging and that crossover signals are likely to be unreliable.
The line itself often behaves as dynamic support or resistance, with price pulling back to a key SMA and bouncing in an uptrend or rejecting from it in a downtrend. Crossovers add another layer, whether it is price crossing the line or one SMA crossing another. Because the SMA is a confirmation tool rather than a trigger, experienced traders rarely act on it alone. They pair it with volume and momentum gauges like the RSI oscillator to filter out the false signals the SMA produces in choppy conditions.
Why the SMA Still Matters in 2026
Despite being more than a century old, the SMA remains front and center in crypto in 2026. The 200-day and 200-week lines are still treated as long-term battlegrounds, and 50/200 crossovers still make headlines whenever Bitcoin shifts trend. The 200-week SMA in particular is often described as the closest thing Bitcoin has to a long-term floor, a level it has rarely held below for long.
Its role is also evolving. Rather than serving only as a line on a chart, smoothed averages now feed modern forecasting systems as trend inputs, distilling noisy price into a clean directional signal that models can learn from. You can see that logic at work on a coin price prediction page, where moving averages help frame the trend context behind a forecast. The honest takeaway is unchanged from the day the tool was born: the SMA is a powerful way to read the trend, but it confirms the past rather than guaranteeing the future. Treat it as one input among many, never as financial advice.
 Stay Ahead in Crypto