What Is the Momentum Indicator?
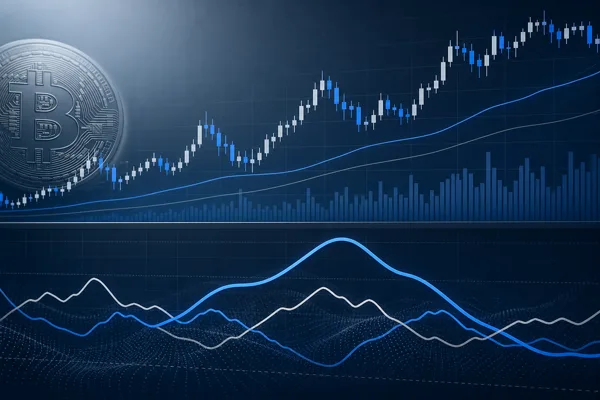
Key Takeaways Momentum measures how fast price is rising or falling by comparing today's close to the close a set number of periods ago. On a 10-period setting…

Key Takeaways The ADX measures how strong a trend is, not which direction it points, on a scale from 0 to 100. It travels…
Jul 11, 2026Key Takeaways Momentum measures how fast price is rising or falling by comparing today's close to the close a set number of periods ago. On a 10-period setting…
Key Takeaways The ADX measures how strong a trend is, not which direction it points, on a scale from 0 to 100. It travels with two companion lines,…
Key Takeaways The VWMA is a moving average that weights each period's price by its trading volume, so busy, high-volume candles pull the line more than quiet ones.…
Key Takeaways The Simple Moving Average (SMA) is the plain average of an asset's last N closing prices, plotted as a smooth line that reveals the underlying trend.…
Key Takeaways Pivot points are support and resistance levels calculated from the previous period's high, low, and close, with one central pivot (P), three resistances (R1-R3), and three…
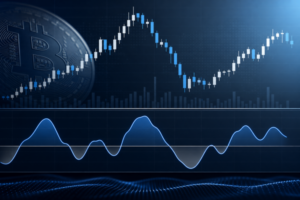
Key Takeaways Stochastic RSI applies the Stochastic formula to RSI values, making it a momentum-of-momentum oscillator that reacts faster than plain RSI. Readings above 0.8 signal overbought conditions…
Key Takeaways Trump Media and Crypto.com announced "Truth Predict" on 28 October 2025, a plan to embed regulated prediction markets directly inside Truth Social. Users would trade event…
Key Takeaways The Ichimoku Cloud is an all-in-one indicator that shows trend, momentum, and support or resistance in a single view. It plots five lines built from rolling…
Key Takeaways Pearson correlation is a single number from -1 to +1 that measures how closely two assets' returns move in a straight line: +1 is lockstep, 0…
Replay attacks retransmit signed blockchain transactions so they execute twice. Learn how chain IDs, nonces, and multisig prevent them.
Learn what a dead cat bounce is in crypto: a temporary price recovery after a sharp decline that often misleads investors into thinking a reversal has started.
Falling knives are sharp price drops in crypto, often driven by bad news. Dollar-cost averaging, diversification, stop-losses, and patience cut the risk.
How Bitcoin CFDs work, a worked leverage example, broker comparison, and the regulatory limits and risks you need to know before trading.
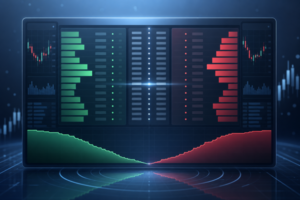
An order book is a real-time list of buy and sell orders at various prices. Learn how to read order books, understand market depth, and spot buy and…
Satoshi Nakamoto is the pseudonym behind the creation of Bitcoin in 2008. Despite years of investigation, their true identity remains unknown. This article explores the most credible candidates.
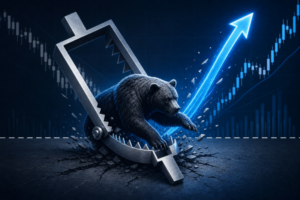
A bear trap is a fake breakdown that snaps back upward, catching traders who shorted the move. Learn how to spot, avoid, and manage one.
Showing 16 of 26 articles