Key Takeaways
- MACD measures the difference between two Exponential Moving Averages, making it useful for both trend detection and momentum analysis.
- Traders use three MACD signals: line crossovers, overbought or oversold histograms, and price divergences.
- MACD works best when combined with at least one other indicator, as it can generate false signals in sideways markets.
In This Article
What is MACD?
MACD stands for Moving Average Convergence/Divergence and is an indicator traders use to identify the direction and strength of a price trend. Developed by Gerald Appel in the late 1970s, it has become one of the most widely used tools in technical analysis for stocks, cryptocurrency, options, and other securities.
The MACD is calculated using three components:
- MACD line: 12-day EMA minus 26-day EMA
- Signal line: 9-day EMA of the MACD line
- MACD Histogram: MACD line minus Signal line
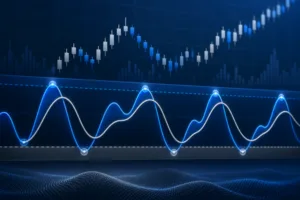
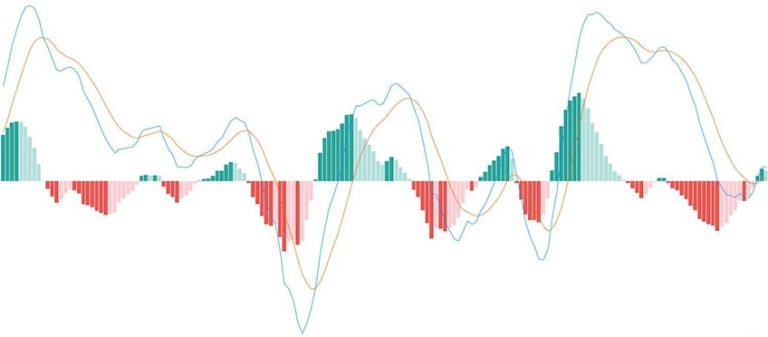
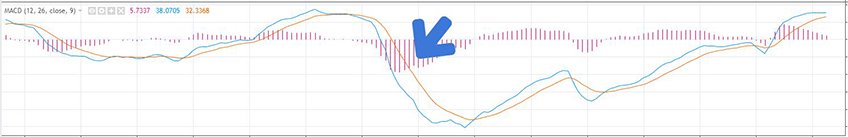
In the examples below, the blue line is the MACD line. The orange line is the signal line and the red candles form the histogram. All three components can be used independently or combined for trading strategies.
Spot the trend
You can read the MACD indicator in a straightforward way:
- In an upward trend, the signal line is below the MACD line.
- In a downward trend, the signal line is above the MACD line.
Upward trend
Downward trend
Trading strategies with the MACD indicator
The MACD indicator can be used in many trading strategies. Below are three common examples you can start applying yourself.
MACD crossover
You can see from the MACD indicator whether an asset is moving upwards or downwards by looking at which line is on top. With the MACD crossover strategy, you use the moment the lines cross as an entry signal to go long or short.
In the image below, the green arrows mark moments to go long and the red arrows indicate moments to go short.
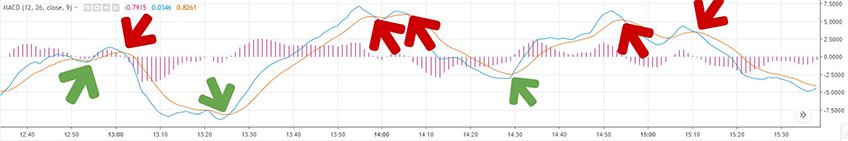
If you look closely, the lines cross more often than buy and sell signals are given. As with many indicators, it is wise to use a filter to reduce false signals. With this strategy, you only go short if both lines are above the 0-axis, and only long if both lines are below the 0-axis.
Overbought and oversold
The MACD indicator is not only a trend indicator but also a useful tool for identifying whether an asset is overbought or oversold. Overbought means the price of an asset has risen too fast recently. Oversold means the opposite. When an asset reaches either extreme, there is a good chance the price will reverse direction soon.
To use the MACD histogram for this, draw two boundary lines at the levels where the histogram normally peaks. The upper line marks the range where the asset is rising; the lower line marks the range where it is falling.
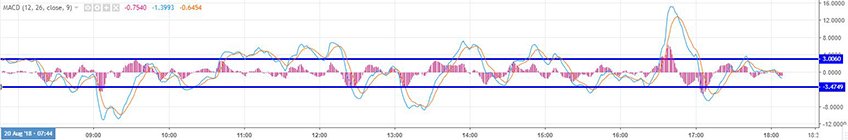
As shown above, the histogram briefly exceeded the normal upper boundary before a sharp downward move followed. Using this as a trading signal would have produced a profit on a short position.
Divergence
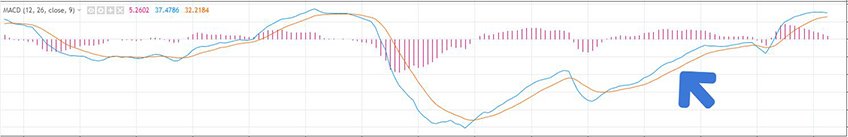
You can also use the MACD to assess whether a trend still has enough momentum. A second top in the price chart combined with a lower MACD signal line top indicates a bearish divergence, suggesting the uptrend is losing strength. A second bottom in a downtrend combined with a higher MACD signal line bottom indicates a bullish divergence.
Bullish divergence

Bearish divergence

In both cases, the divergence was followed by a price movement in the opposite direction. As with any other technical analysis strategy, a signal becomes stronger when confirmed by a second indicator or by price action itself.
Advantages and limitations
The MACD is popular for good reasons, but it also has real limitations worth knowing.
Advantages:
- Versatile: works for trend identification, momentum measurement, and spotting potential reversals.
- Visual clarity: the histogram makes it easy to see at a glance whether momentum is building or fading.
- Widely supported: available on every major charting platform with no custom setup required.
Limitations:
- Lagging indicator: because it is based on moving averages, MACD reacts to price changes rather than predicting them.
- False signals in sideways markets: when price moves horizontally, the MACD lines cross frequently without producing meaningful moves.
- Best used with confirmation: relying on MACD alone increases the risk of entering on a false signal.
Final thoughts
The MACD indicator is one of the most reliable tools in technical analysis when used correctly. It gives traders a clear picture of trend direction, momentum, and potential reversals in a single indicator. To get the most out of it, combine MACD signals with at least one other indicator such as the RSI or volume analysis, and apply a filter to reduce noise in choppy markets.
 Stay Ahead in Crypto