Key Takeaways
- Technical analysis studies the price history of an asset to predict its future direction, ignoring underlying fundamentals.
- The two main branches are price action (chart patterns) and indicators (calculations like MACD, RSI, and moving averages).
- No indicator is correct on its own; traders combine signals with strict risk management and a stop loss to limit losses.
In This Article
Introduction
TA is the abbreviation for Technical Analysis. Technical analysis focuses entirely on the price development of an asset. When performing a TA, the underlying facts of the asset are not taken into account (stocks, cryptocurrencies, options, and so on), only the historical price.
Over the years, numerous strategies and indicators have been developed to predict the price development of an asset. There are two different types of technical analysis:
- Price action
- Trading indicators
Price action focuses on the price development itself. By recognising patterns in the movement of the price, traders make predictions about where it might go next.
Trading indicators are formed by performing calculations on the historical price, often to smooth out noise or to flag overbought and oversold conditions.
Frequently used indicators
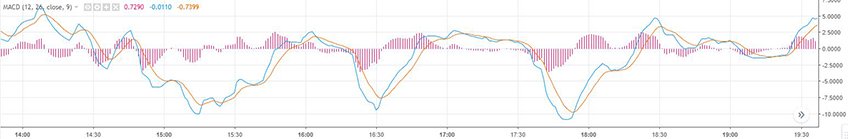
Moving Average Convergence Divergence (MACD)
MACD stands for Moving Average Convergence Divergence and is a tool used by traders to identify the trend of a price. The indicator consists of three parts. A 26-day exponential moving average (EMA) is subtracted from a 12-day EMA. This calculation produces the MACD line. The third part is a 9-day EMA of the MACD line, called the signal line. A commonly used strategy: as soon as the signal line breaks through the MACD line from below, a buy order is placed. As soon as the signal line breaks through the MACD line from above, a short order is placed.
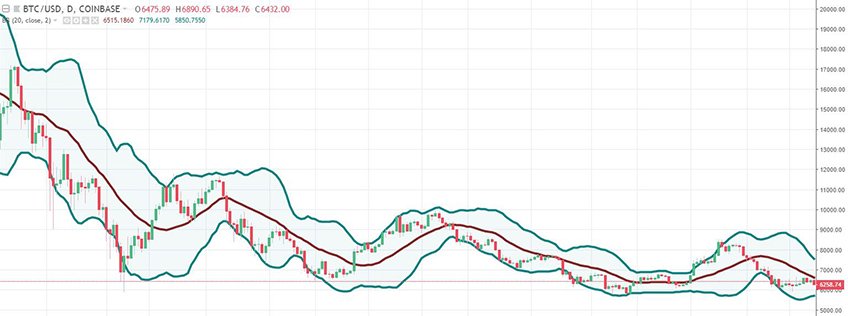
Bollinger Bands
Bollinger Bands consist of a Simple Moving Average (SMA) with two standard deviations plotted around it. One standard deviation sits above the SMA and the other below it. Bollinger Bands are widely used by both professional investors and beginners, and they can be applied to both trend-following and range-trading strategies.
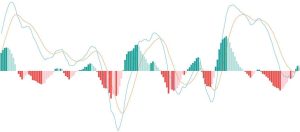
Stochastic Oscillator
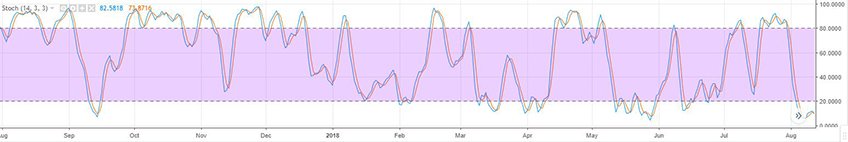
The Stochastic Oscillator was developed by George Lane in the late 1950s. Bullish or bearish divergences can be predicted with the Stochastic Oscillator, and it shows at a glance whether an asset is overbought or oversold.
The Stochastic Oscillator consists of two lines. The main line is called the %K line and the second line is the %D line. The %D line is a three-period moving average of the %K line. The two lines always move between 0 and 100. If they move above the 80 limit, the asset is overbought. If they go below the 20 boundary, it is oversold.
In the image below the blue line is the %K line and the orange line is the %D line.
Relative Strength Index (RSI)
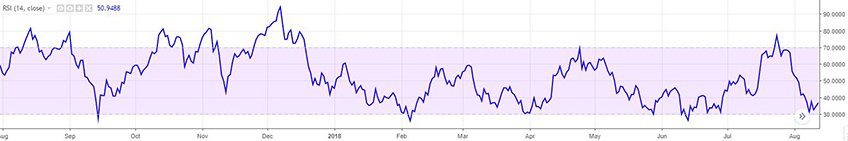
With the Relative Strength Index, traders can quickly see whether an asset is overbought or oversold, just as with the Stochastic Oscillator. The RSI measures the speed and direction of a price movement. If the line is above 70, the asset is in an overbought situation. If the line is below 30, it is oversold. Some traders use 80 and 20 as the upper and lower limits instead.
Simple Moving Average (SMA)
The Simple Moving Average is the simplest indicator in this list. An SMA is a line built from the last closing prices divided by the number of periods. In other words, it shows the average price over a chosen period. The shorter the period, the faster the SMA responds to a price change, but also the noisier the signal. For broader context on related indicators, see our moving average explainer.
Common strategies
SMA (Simple Moving Average) crossover
For the SMA crossover strategy you need three different SMAs. A short SMA (for example 9), a medium SMA (60), and a long SMA (100). As soon as the short and medium SMAs cross the long SMA from below, a buy signal occurs. If the opposite happens and the short and medium SMAs cross the long SMA from above, a sell signal occurs.
In the image below the green circles mark moments to go long and the red circle marks a moment to go short.
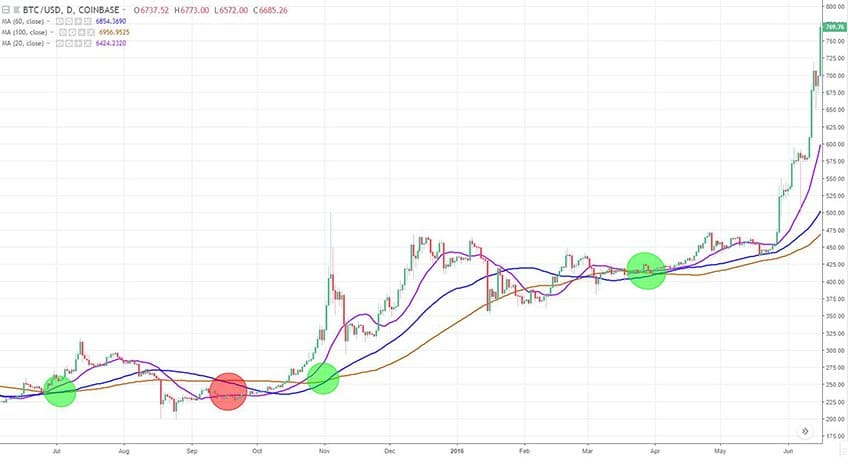
If we had used this strategy here, we would have made a profit on the long trades and a loss on the short trade.
As with any strategy, you never know for sure which direction the price is heading, so it is important to always set a stop loss. With this strategy you place your stop loss just below the longest SMA (100) in case of a long position. For a short position, you place the stop loss just above the longest SMA.
Double bottom or double top strategy
The double bottom strategy is a price action strategy and therefore does not rely on indicators, only on the price of an asset.
The double bottom strategy can be used on an asset that is in a downward trend. You wait until the price makes a retracement and then drops again. If the price does not fall any further than the previously formed bottom, this is a signal that the price might form a double bottom.
See the image below for an example:
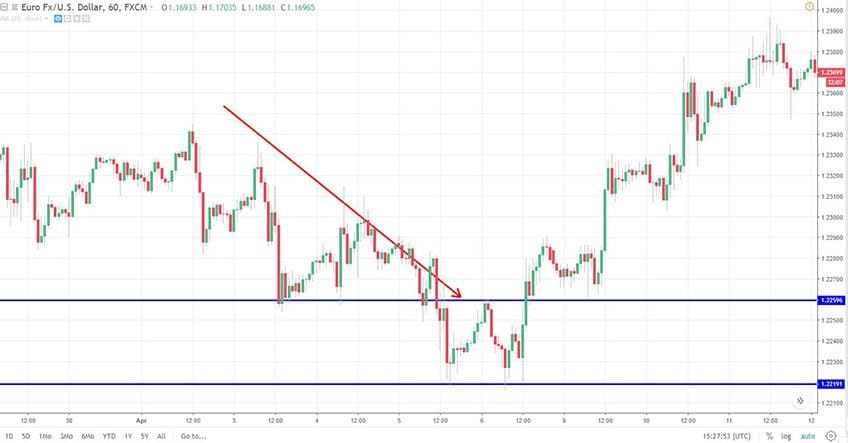
When the bottom is reached for the second time, you do not take a position immediately. Instead, you wait until the direction has broken the neck (the upper blue line). You can do this by setting an alert or by placing a buy stop, if your trading software supports it.
The moment to go long is at the green arrow:
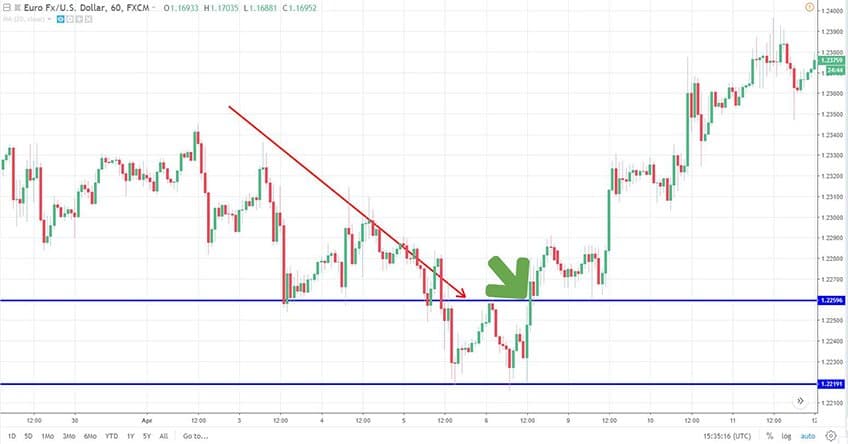
This strategy can also be used when an asset is in an upward trend. The setup is then mirrored: a double top signals a possible reversal to the downside.
The Bollinger bounce
The Bollinger bounce is a range-trading technique. Markets spend most of their time between certain price levels, also called support and resistance. As a trader you can use this by going long when a support level is reached and going short when a resistance level is reached. You can calculate these levels by drawing a horizontal line at the level of the last top and bottom, or by using the Bollinger Bands themselves. The bands form dynamic support and resistance.
The technique is straightforward: as soon as the price hits the upper band, you open a short position. As soon as it hits the lower band, you open a long position. Set the stop loss to 50% of the range of the bands. With a risk of 1 euro you can earn about 2 euros per profitable trade, assuming the price stays in its range.
In the image below the green arrows mark moments to go long and the red arrows mark moments to go short.
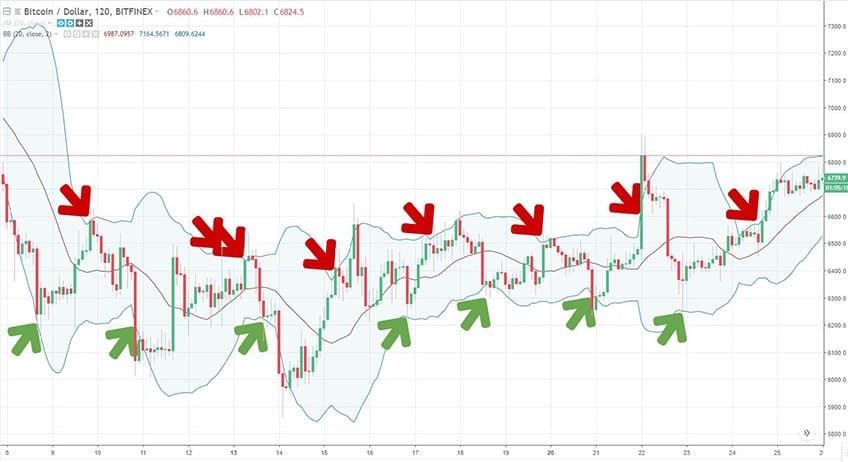
If you look closely, you can see that the price touches the edges more often than we have taken a position. This is because the price must first have broken the middle line before you take a second short or long position. If you do not follow this rule you will get a lot of false signals and you can lose quite a lot as soon as the price starts to trend upward or downward. You may even tighten this rule by never holding two identical positions at the same time.
Breakout strategy
The breakout strategy, like the double bottom strategy, is a typical price action setup. You look for a price level that the market has had trouble breaking. As soon as that level is broken, you go long or short depending on whether the price moves up or down. Place the stop loss just below the resistance level in case of a long position. For a short position, place the stop loss just above the support level.
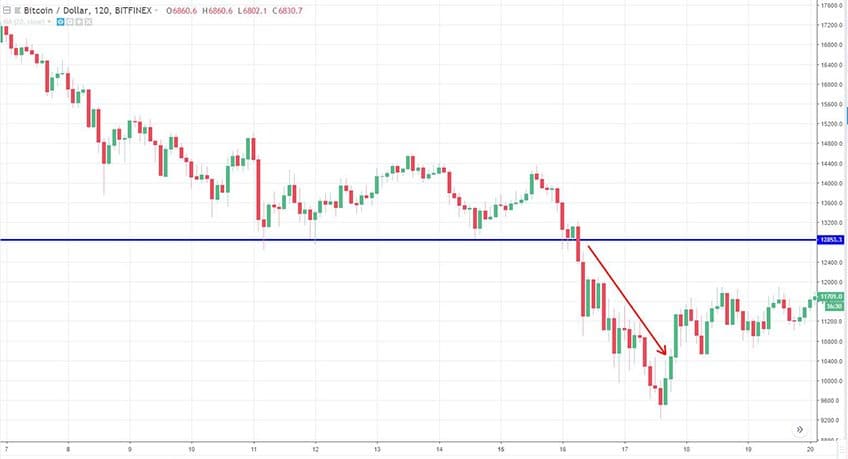
As you can see in the image above, the price bounces three times off the blue line. That is a sign that there is a support level there. As soon as the price breaks through, it drops down even more rapidly.
When the price breaks through a support level, the move can accelerate. Stop losses of traders who are long get triggered, forcing automatic sales. That adds downward pressure. The opposite happens when the price breaks above a resistance level: short sellers have to buy back their borrowed shares, creating upward pressure.
Limitations of technical analysis
Technical analysis is a useful framework, but it is not a crystal ball. A few things to keep in mind:
- Signals fail. Every indicator generates false signals, especially in choppy or low-liquidity markets. No setup wins every time.
- News overrides charts. A surprise regulatory headline, exchange outage, or large liquidation can break any technical pattern instantly.
- Timeframes matter. A bullish signal on a 15-minute chart can sit inside a bearish trend on the daily chart. Always check the higher timeframe before acting.
- Backtests are not promises. A strategy that worked over the last two years may stop working as soon as market conditions change.
The traders who get the most out of TA combine it with disciplined risk management: a fixed risk per trade, a predefined stop loss, and an exit plan for both winners and losers.
Where to trade
Once you have a strategy you want to try, the next step is choosing a venue. Pick an exchange that fits your needs in terms of available pairs, fees, charting tools, and jurisdiction. Read independent reviews and check whether the exchange supports advanced order types such as stop limit or trailing stop, since these are essential for the strategies above. Browse our full list of crypto exchanges to compare options side by side.
 Stay Ahead in Crypto