Key Takeaways
- Pivot points are support and resistance levels calculated from the previous period’s high, low, and close, with one central pivot (P), three resistances (R1-R3), and three supports (S1-S3).
- They are a leading tool: the whole grid of levels is known before the session starts, so traders use it to plan entries, stops, and targets in advance.
- Price above the pivot signals a bullish bias and below it a bearish one, but the levels work best with volume and candlestick confirmation rather than on their own.
In This Article
Levels traders know before the day starts
Most indicators react to price after it moves. Pivot points do the opposite. Using nothing more than yesterday’s high, low, and close, they map out a grid of support and resistance levels for the day ahead, and that whole map is fixed before the first candle of the session even prints.
That forward-looking quality is what makes them a staple of technical analysis, especially for short-term traders. Instead of waiting for a signal to form, a trader can open the chart and already know the levels where price is likely to stall, bounce, or break.
Pivot points at a glance
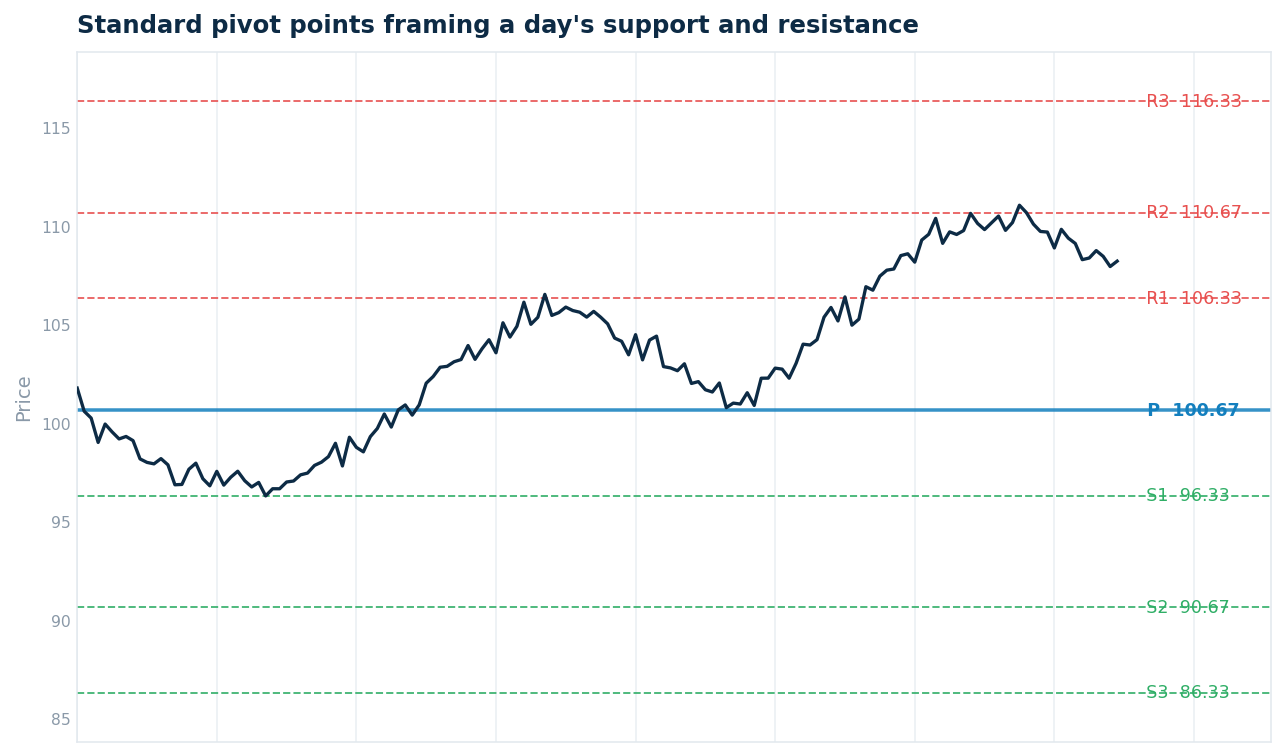
A pivot point is a price level calculated from the previous period’s trading range and used to gauge the market’s likely direction. A full set has seven levels: one central pivot, labelled P, three resistance levels above it (R1, R2, R3), and three support levels below it (S1, S2, S3).
The central pivot is the anchor. It represents a rough average of the prior session and acts as the dividing line between bullish and bearish territory. The resistance levels mark where an advance may run into selling, and the support levels mark where a decline may find buyers. Together they turn a blank chart into a ladder of reference points for the session.
How pivot points are calculated
The standard, or “classic,” method starts with the pivot itself, the average of the prior period’s high, low, and close.
- P = (High + Low + Close) / 3
From that single number, the support and resistance levels are projected outward:
- R1 = (2 x P) – Low and S1 = (2 x P) – High
- R2 = P + (High – Low) and S2 = P – (High – Low)
- R3 = High + 2 x (P – Low) and S3 = Low – 2 x (High – P)
Every level is plain arithmetic on three numbers, which is exactly why the tool caught on. Reaching R1 or S1 is common during a normal session, R2 and S2 mark stronger moves, and a touch of R3 or S3 signals an unusually large day that traders often read as stretched.
Reading the pivot and its levels
The first thing traders check is which side of the pivot price is on. Trading above P points to a bullish bias for the session, with R1 and then R2 as upside targets. Trading below P points to a bearish bias, with S1 and S2 as the levels to watch on the way down.
From there, two playbooks dominate. In a range, traders fade the levels by buying near support and selling near resistance, betting the level holds. In a breakout, they trade through a level once price pushes past it with momentum, aiming for the next level up or down. If Bitcoin opens above its daily pivot and reclaims R1 on strong volume, for example, R2 becomes the logical next target.
From the trading floor
Pivot points come from the futures pits, decades before screens and charting software. Floor traders needed levels they could work out by hand before the opening bell, and a formula built on just the prior day’s high, low, and close fit the bill perfectly. A trader could jot the numbers on a card and carry them into the session.
When electronic trading arrived, the levels stayed popular and spread into forex, a market whose near round-the-clock sessions suited them well. From there it was a short step into crypto, where they are now a common fixture on trading charts.
Using pivot points in crypto
Crypto adds one wrinkle the stock market does not have: there is no closing bell. Because coins trade 24/7, traders have to choose a daily close convention, and the widely used standard is 00:00 UTC. Most major exchanges strike their daily candle at UTC midnight, so calculating pivots from the UTC daily candle keeps the levels consistent no matter where a trader sits. If a chart is set to a local time zone instead, the prior-day range shifts and every level moves with it.
Beyond the daily chart, weekly and monthly pivots help frame the bigger picture, which is useful in a market as volatile as crypto. On a coin’s price prediction analysis, pivot levels give a concrete, rules-based way to describe near-term support and upside targets rather than vague guesses. The levels are still only a framework, though, and work best when a bounce or breakout is backed by rising volume or a clear candlestick signal.
Other types of pivot points
The classic formula is the most watched, but several variants adjust the math.
- Fibonacci: keeps the same pivot but spaces the levels at 38.2%, 61.8%, and 100% of the prior range.
- Woodie’s: weights the close more heavily, making the pivot more sensitive to the most recent price.
- Camarilla: uses the prior close with set multipliers to produce four tightly spaced support and resistance levels, favoured for reversals.
- DeMark: shifts the calculation based on where the close sits relative to the open, projecting a single high and low rather than a full ladder.
Why traders use pivot points
- Objective levels: the math is fixed, so every trader sees the same numbers with no guesswork.
- Leading, not lagging: the levels are known before the session, supporting a plan rather than a reaction.
- Works anywhere: the same method applies to any coin, market, and timeframe.
- Self-reinforcing: because so many traders and bots watch the same classic levels, price often genuinely reacts at them.
- Built-in risk framework: the levels translate directly into entry, stop, and target placement.
The limits of pivot points
- Blind to news: a regulatory headline or hack will cut straight through any level.
- Weak in strong trends: a powerful move can slice through resistance without pausing.
- Session ambiguity: the missing crypto close means a mismatched time zone produces misleading levels.
- Needs confirmation: on their own the levels generate false bounces, so pair them with tools like the MACD indicator or volume.
- Crowded levels get hunted: stops clustered around well-known pivots attract stop-runs, common in crypto.
Putting pivot points to work
Pivot points are at their best as a map, not a signal. They tell a trader where the meaningful levels sit before the day begins, which is half the battle in fast crypto markets. The other half is confirmation: a bounce off S1 or a break above R1 means far more when volume and price action agree with it. Like other widely followed signals such as the Golden Cross and Death Cross, pivot levels draw much of their power from how many traders act on them, so the most useful approach is to treat them as a shared framework and let the rest of the chart confirm the trade.
 Stay Ahead in Crypto