
Key Takeaways
- Stochastic RSI applies the Stochastic formula to RSI values, making it a momentum-of-momentum oscillator that reacts faster than plain RSI.
- Readings above 0.8 signal overbought conditions and readings below 0.2 signal oversold, with %K and %D crossovers used to time entries and exits.
- Its speed produces more signals and more noise, so traders pair it with a trend filter rather than trading it on its own.
In This Article
An indicator of an indicator
Stochastic RSI, usually shortened to StochRSI, is a momentum oscillator that measures where the current RSI reading sits within its own high and low range over a set period. Most indicators run their formula on price. StochRSI runs its formula on the output of another indicator, which is why traders describe it as an indicator of an indicator, or momentum of momentum.
That extra step is the whole point. RSI is already one move away from price, since it is built from average gains and losses. StochRSI takes those RSI values and places them in context, sitting two steps away from price. The result is a more sensitive reading that flags overbought and oversold conditions sooner than RSI does, which makes it a popular timing tool within technical analysis.
How Stochastic RSI works
The starting point is the RSI oscillator, which scores price momentum on a scale of 0 to 100. StochRSI then looks at the highest and lowest RSI values over a lookback period, usually 14, and works out where the latest RSI value falls between them.
The calculation is simple:
- StochRSI = (current RSI – lowest RSI) / (highest RSI – lowest RSI)
The raw output sits between 0 and 1, where 0 means RSI is at the bottom of its recent range and 1 means it is at the top. Most charting platforms multiply this by 100 to show a 0 to 100 scale instead, and both versions read the same way.
Two lines are usually plotted on the indicator. The %K line is the main, faster line, and the %D line is a short moving average of %K that acts as a slower signal line. The common default setting is 14, 14, 3, 3, which sets the RSI length, the Stochastic length, and the smoothing on each line. Shorter settings make it quicker but noisier, while longer settings smooth it out for higher timeframes.
Reading overbought and oversold
StochRSI uses wider extremes than RSI. A reading above 0.8, or 80 on the 0 to 100 scale, points to overbought conditions, while a reading below 0.2, or 20, points to oversold conditions. The 0.5 centerline acts as a rough divider: sustained readings above it lean bullish, and readings below it lean bearish.
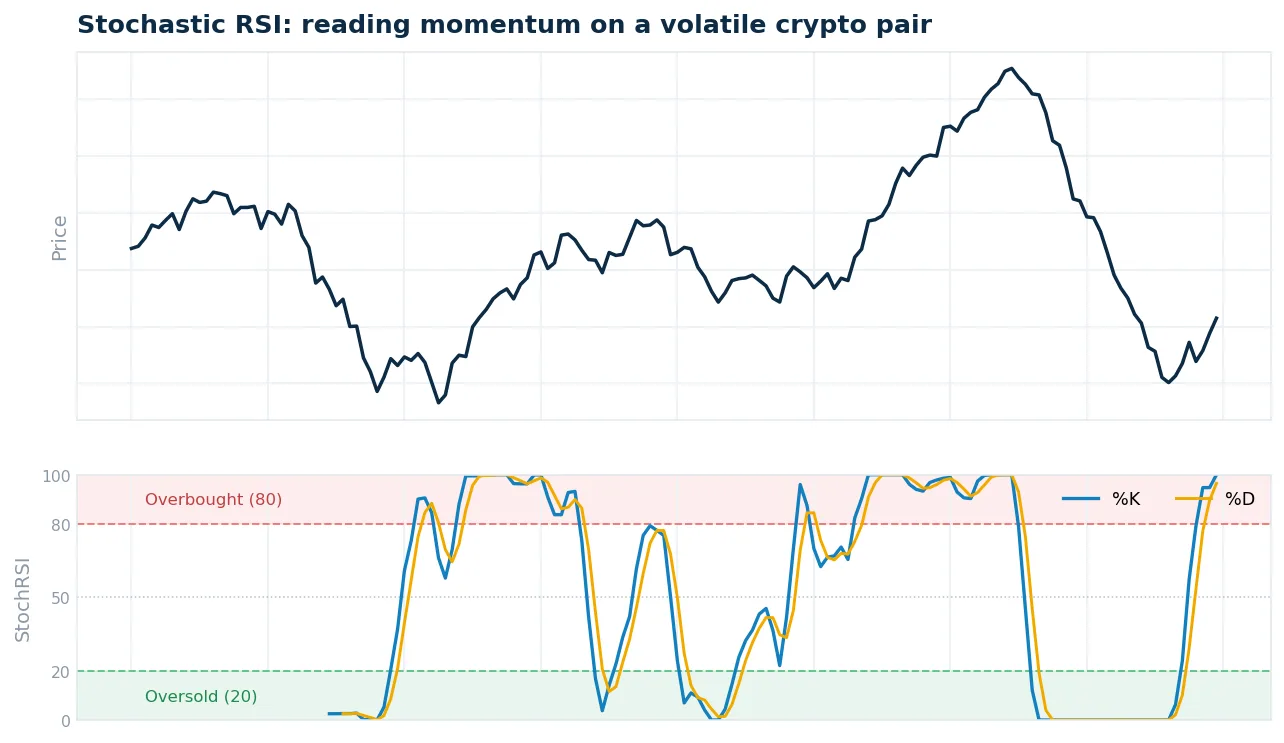
Crossovers add a second layer. When %K crosses above %D inside oversold territory, it can mark an early upward turn. When %K crosses below %D inside overbought territory, momentum may be fading. Crossovers near the middle of the range carry far less weight and usually need confirmation from price action or another tool.
Where StochRSI came from
Stochastic RSI was introduced by Tushar Chande and Stanley Kroll in their 1994 book The New Technical Trader. They noticed that plain RSI rarely reached its traditional overbought and oversold levels, often drifting between 20 and 80 for long stretches. Traders waiting for those extreme readings were frequently left on the sidelines.
Their fix was to measure RSI against its own recent range, so the indicator would reach its extremes more often and give more timely signals. The trade-off they accepted was a noisier reading, which is still the defining feature of the tool today.
Using Stochastic RSI in crypto
Crypto markets move fast and swing hard, which suits an oscillator built for sensitivity. On volatile pairs, StochRSI can flag short-term reversals well before RSI reacts, helping traders time pullbacks and swings rather than chase them.
It shows up most often in entry and exit timing. On a coin’s price prediction analysis, for example, a bullish %K and %D crossover out of oversold territory carries more weight when it agrees with the wider trend. Many traders also adjust the bands for highly volatile altcoins, widening them to something like 90 and 10 to cut down on false triggers.
The catch in crypto is that strong trends can pin the indicator at an extreme for days. Because of that, StochRSI is almost always paired with a trend filter such as a moving average, so an overbought reading in a powerful uptrend is treated as strength rather than an automatic sell.
StochRSI vs RSI vs the Stochastic Oscillator
It is easy to confuse the three oscillators, since they share names and ranges. The key difference is what each one measures and how far it sits from price.
| Indicator | What it measures | Input | Typical levels |
|---|---|---|---|
| RSI | Speed and size of price changes | Price | 70 / 30 |
| Stochastic Oscillator | Where the close sits in the recent price range | Price | 80 / 20 |
| Stochastic RSI | Where RSI sits in its own recent range | RSI values | 0.8 / 0.2 |
In short, RSI and the Stochastic Oscillator both read price directly, while StochRSI reads RSI. That extra step is what makes it the fastest and most reactive of the three, and also the most prone to noise.
Advantages and limitations
StochRSI earns its place in many trading setups, but its strengths come with clear trade-offs.
Advantages:
- Faster signals: it reacts to momentum shifts earlier than RSI, helping catch short-term turns.
- More frequent reads: it reaches overbought and oversold levels far more often, so it rarely leaves traders waiting.
- Strong in ranges: it is well suited to timing pullbacks and swings in sideways markets.
Limitations:
- Noisy signals: the same speed that helps in ranges produces whipsaws in choppy conditions.
- Pins in trends: it can sit at an extreme for long stretches during strong moves, giving misleading reversal cues.
- Needs confirmation: used alone it produces too many false signals, so it works best alongside tools like the MACD indicator or a moving average.
Putting StochRSI to work
For crypto traders, StochRSI earns its keep when a market is chopping sideways and you need an early read on the next swing. The trade-off never goes away: it fires often, and plenty of those signals lead nowhere. The traders who get value from it wait for a cross out of the 0.8 or 0.2 zone to line up with the trend on a higher timeframe before acting. On fast-moving assets like Bitcoin, that bit of patience is usually what separates using StochRSI well from getting chopped up by it.
 Stay Ahead in Crypto