English
  Nederlands
  Deutsch
Key takeaways
- The Awesome Oscillator (AO) measures momentum by subtracting a 34-period moving average from a 5-period one, both taken from each bar’s median price rather than its close.
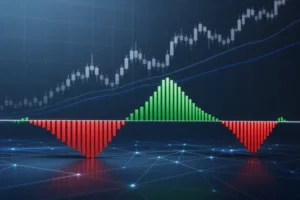
- It plots as a green and red histogram around a zero line: above zero signals bullish momentum, below zero bearish, and bar color shows whether that momentum is building or fading.
- Traders read three classic signals from it, the zero-line cross, the saucer, and twin peaks, but AO lags and needs confirmation, so it works best next to trend and price context.
In this article
Reading momentum at a glance
Price tells you where a market is. Momentum tells you how hard it is getting there, and whether that push is speeding up or fading. The Awesome Oscillator is one of the most direct ways to see that second story. Instead of a line to interpret, it draws a simple histogram of green and red bars around a zero line, so a glance shows which way momentum leans and whether it is strengthening.
That plain visual keeps it popular with crypto traders decades after it was designed. It belongs to the wider toolkit of technical analysis, where chart signals frame probabilities rather than certainties.
The Awesome Oscillator defined
The Awesome Oscillator (AO) is a momentum indicator that compares recent short-term momentum with longer-term momentum. It does this by subtracting a slow moving average from a fast one, and it uses the middle of each price bar rather than the closing price.
In practice AO answers one question: is the momentum of the last handful of bars stronger or weaker than the momentum of the last several dozen? When the short-term average pulls ahead, the histogram rises above zero; when it falls behind, it drops below. Because it has no fixed ceiling or floor, AO shows the size of a momentum swing as well as its direction.
Where it came from
AO was created by Bill Williams (1932 to 2019), a trader and psychologist who spent years applying chaos theory to financial markets. The indicator formally appeared in his 1998 book New Trading Dimensions, part of the broader Trading Chaos system he had introduced earlier in the 1990s.
Williams described markets in five dimensions read in order, and AO is the second, the momentum dimension. That origin matters: he never meant it as a standalone buy-and-sell machine, but as one confirming layer inside a larger method.
How does the Awesome Oscillator work?
The calculation is deliberately simple, which is part of its appeal. Every value comes from two moving averages of the median price.
The formula
First, each bar’s median price is the average of its high and low: (High + Low) / 2. AO then subtracts a 34-period simple moving average of that median price from a 5-period one:
AO = SMA(median price, 5) minus SMA(median price, 34)
Using the bar midpoint instead of the close makes AO less sensitive to a single wick or a lone closing print, and there is no signal line to complicate the reading. The histogram itself is the indicator.
Reading the bars
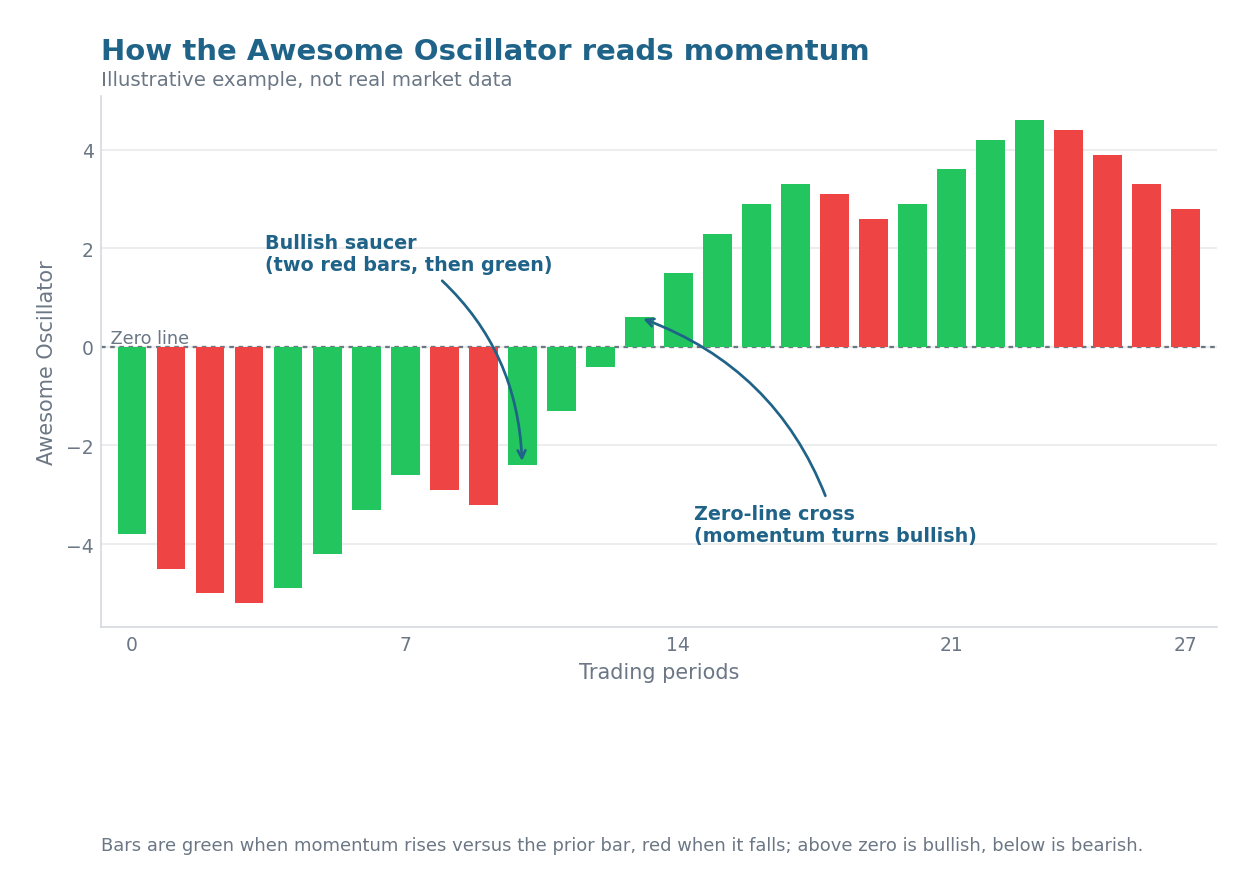
Two properties carry the meaning. First, which side of zero a bar sits on: above zero means short-term momentum is beating long-term momentum, below zero means the opposite. Second, bar color, which is set bar to bar, not by the zero line. A bar is green when it is higher than the one before it, red when it is lower. So a green bar can sit below zero, momentum still negative but improving, and a red bar above zero, still positive but fading.
The three classic AO signals
Traders typically watch for three setups. Each has a different speed and sensitivity, which is one reason AO is more flexible than a single overbought line like the one on the bounded RSI oscillator.
Zero-line crossover
The simplest signal. A cross from below zero to above means short-term momentum has overtaken long-term, a potential buy; the reverse cross is a sell. Robust but slow, since it confirms only after the crossover completes.
The saucer
A faster, three-bar signal that stays entirely on one side of zero. A bullish saucer forms above zero: two red bars, the second lower than the first, then a green bar that triggers the entry. A bearish saucer is the reverse below zero. It reads as momentum dipping, then turning back within an ongoing trend.
Twin peaks
A divergence-style signal comparing two momentum peaks on the same side of zero, with the trough between them never crossing the line. Bullish twin peaks below zero show a second low that is higher (less negative) than the first, hinting that downside momentum is exhausting. Bearish twin peaks above zero show a lower second high. If the middle trough breaks through zero, the pattern is void.
Using AO in crypto markets
Crypto suits AO well. Markets trade 24/7 with no session close, so the closing price many indicators lean on is somewhat arbitrary, and AO’s bar midpoint sidesteps that. Its unbounded histogram also expands during the sharp volatility that defines crypto, making big momentum surges easy to spot as tall green or red bars.
On a per-coin signal view it maps to a clear state: above zero for bullish momentum, below for bearish, with bar color showing whether that push is building or fading. You can see this kind of context feeding the outlook on a coin’s Dogecoin price prediction page, where several indicators are combined rather than read alone. Traders usually pair AO with a trend filter so its signals are confirmed, not taken at face value.
Benefits of the indicator
- A clear visual momentum read: direction (above or below zero) and whether momentum is building or fading (bar color) with no numbers to decode.
- Built on the median price, so it is less distorted by a single wick or closing print, which fits continuous 24/7 crypto markets.
- Three well-defined signals (zero cross, saucer, twin peaks) give different sensitivities from one indicator.
- The twin-peaks logic surfaces momentum divergence early, often before price confirms a turn.
- Simple and transparent: just two moving averages, with no signal line or hidden smoothing to second-guess.
Limitations and risks
- It lags. Because it is built from moving averages, signals confirm after a move is already underway, especially the zero-line cross.
- It whipsaws in ranging or choppy markets, firing small saucers and crossovers that lead nowhere.
- There is no fixed overbought or oversold level, so a high reading on one coin is not comparable to a high reading on another.
- It needs confirmation. Used alone it produces too many signals and should be filtered by trend, structure, or a second tool.
- A single anomalous high-low bar, common in thin crypto liquidity, can briefly distort the histogram.
AO vs MACD, RSI and Momentum
The Awesome Oscillator’s closest cousin is MACD, since both subtract a slow average from a fast one and plot a zero-line histogram. The differences sit in the inputs and the extra signals. The table below places AO next to three familiar momentum tools.
| Feature | Awesome Oscillator | MACD | RSI | Momentum |
|---|---|---|---|---|
| Core input | Median price (H+L)/2 | Closing price | Closing price | Closing price |
| Formula basis | SMA 5 minus SMA 34 | EMA 12 minus EMA 26, plus signal line | Average gains vs losses | Price now vs n bars ago |
| Bounded? | No | No | Yes, 0 to 100 | No |
| Overbought or oversold levels | None (read side of zero) | None | Yes, typically 70 / 30 | None |
| Signal line | No | Yes, 9-period | No | No |
| Best used for | Momentum direction, strength, divergence | Trend momentum and crossovers | Overbought or oversold and ranges | Raw rate of change |
Why the Awesome Oscillator matters
Momentum indicators earn their place when they make a hard idea easy to act on, and AO does that: one histogram showing direction, strength, and whether a move is accelerating. On a round-the-clock market its median-price basis and unbounded scale age well, which is why it still appears on modern crypto charts and signal panels.
Like every indicator, it is a lens, not a verdict. Alone it will hand you false signals in quiet markets. Read alongside trend, support and resistance, and the broader momentum picture on a major asset such as Bitcoin, it becomes a useful confirmation tool, the role Bill Williams designed it to play.
 Stay Ahead in Crypto