English
  Nederlands
  Deutsch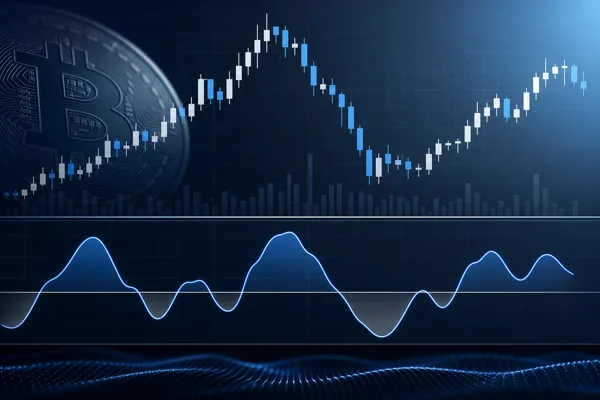
Key Takeaways
- Momentum measures how fast price is rising or falling by comparing today’s close to the close a set number of periods ago.
- On a 10-period setting it is fast and responsive, with a centerline crossover marking the shift between upward and downward momentum.
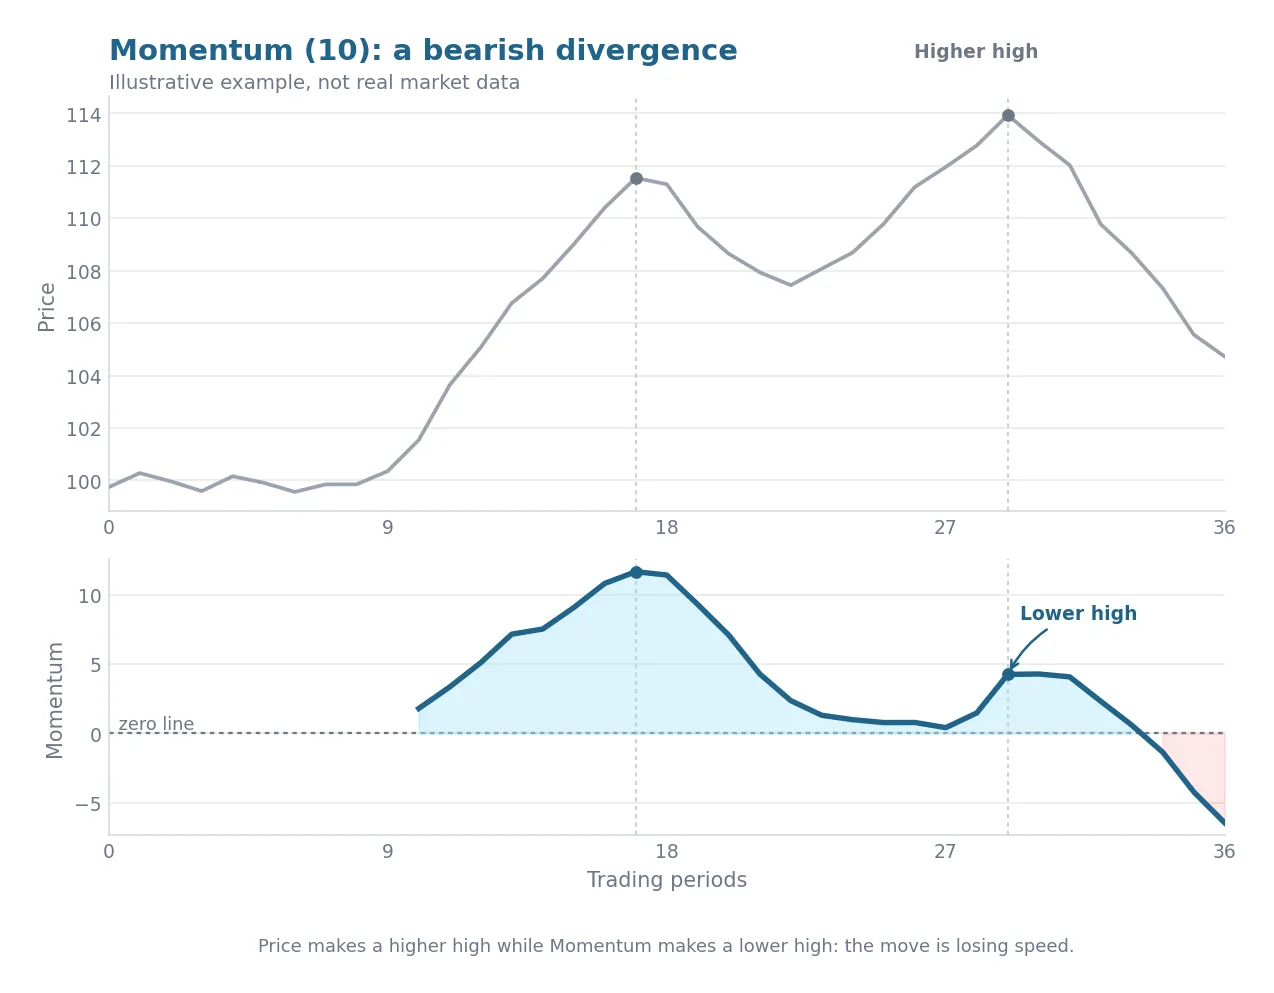
- Its real strength is spotting divergence, when price makes a new high or low but momentum does not, hinting that a move is running out of steam.
In This Article
Why Speed Matters in a Trend
Price tells you where a market is. Momentum tells you how fast it is getting there. Two rallies can look almost identical on a price chart while one is accelerating and the other is quietly running out of steam, and that difference often decides what happens next. Measuring the speed of a move, not just its direction, is one of the oldest ideas in technical analysis, and the Momentum indicator is its most direct expression.
The Momentum Indicator Explained
The Momentum indicator measures the rate of price change by comparing the current closing price to the close a fixed number of periods ago. The “10” simply means it looks back ten periods: today’s close against the close ten candles earlier. Plotted in a panel below the price chart, it swings back and forth around a central line, high and rising when price is gaining ground quickly, low and falling when price is losing it.
One quick note to avoid confusion: several unrelated cryptocurrencies happen to be named Momentum. This article is about the technical indicator, a calculation applied to any asset’s price, not a coin you can buy.
Where Momentum Comes From
Momentum is one of the simplest concepts in charting, the plain rate of change of price, so it has no single inventor. Later authors popularized specific formula conventions rather than creating the idea itself. It is the close sibling of the Rate of Change indicator, and the conceptual ancestor of the bounded oscillators that came later, including the Stochastic and the RSI, which take the same raw momentum idea and squeeze it onto a fixed scale.
How Does Momentum Work?
Momentum comes in two common versions. They plot the identical shape and differ only in the scale they use.
The Two Formulas
The difference version subtracts the close from ten periods ago from the current close, so the line swings around a zero centerline. The ratio version divides the current close by the close ten periods ago and multiplies by 100, so it swings around 100 instead. Either way the reading means the same thing: a positive value, or a figure above 100, tells you price is higher than it was ten periods ago, while a negative value, or a figure below 100, tells you it is lower. A shorter lookback reacts faster and is noisier; a longer one is smoother and slower.
How to Read Momentum
The core signal is the centerline crossover. When Momentum crosses above zero, or above 100, price has pushed back above its level of ten periods ago, a sign of upward momentum that traders often read as bullish. A cross below is bearish. The slope matters too: a rising line means the move is accelerating, while a flattening or falling line means it is losing force even as price edges higher.
The signal many traders value most is divergence. When price makes a new high but Momentum makes a lower high, the latest push came with less speed behind it, an early warning that the move may stall or reverse. The reverse, a new price low against a higher Momentum low, hints at a possible bottom. Because momentum tends to peak before price does, it can act as a leading indicator that flags turns slightly ahead of the chart.
How Crypto Traders Use Momentum
Crypto trades around the clock, so a ten-period window on a daily Bitcoin chart covers ten calendar days with no weekend gaps. Traders apply Momentum (10) to assets like Bitcoin, Ethereum, and Tron in a few recurring ways. They use it to confirm a trend, checking that a rally holds above the centerline rather than fading. They watch the crossover as a short-term entry or exit trigger, since the responsive ten-period setting fires early. And they lean on divergence around major highs and lows as a reversal warning. On coin analysis and prediction dashboards, such as the momentum inputs behind the Tron price prediction, it usually appears as one signal among several, summarized as a simple buy, sell, or neutral read.
Benefits of the Momentum Indicator
- Simple and intuitive: one subtraction or ratio, easy to grasp and to explain.
- Responsive and often leading, giving early warning when a move’s speed shifts.
- Exposes divergence and shows clearly whether a trend is speeding up or slowing down.
- Works on any asset and any timeframe with no special tuning.
Limitations and Risks
Momentum works best paired with a different kind of tool, such as a moving average for trend context, because on its own it has real blind spots.
- Its scale is unbounded, with no fixed overbought or oversold levels like the RSI, so extremes must be judged by eye.
- Readings are hard to compare across assets, especially the difference version, whose units depend on a coin’s price.
- It is noisy and prone to whipsaws at a short setting like 10, with false crossovers in choppy markets.
- It is still derived from past closes, so it confirms as much as it predicts and needs backup from other tools.
Momentum vs ROC and RSI
Momentum is often confused with two close relatives. The first is the Rate of Change, or ROC, which is essentially the same indicator expressed as a percentage. Where Momentum takes the raw gap between now and ten periods ago, ROC divides that gap by the old price. The two cross their centerlines at exactly the same moments, so ROC is really just the more comparable, percentage-normalized dialect of the same tool.
The more useful contrast is with the RSI. Both measure momentum, but the RSI is mathematically capped between 0 and 100, so a reading of 70 means overbought and 30 oversold on any coin or timeframe. Raw Momentum has no such ceiling, which makes it simpler and more direct for reading pure speed but leaves the question of how high is too high to judgment.
| Indicator | Scale | Overbought/oversold | Best at |
|---|---|---|---|
| Momentum (10) | Unbounded (around 0 or 100) | No fixed levels | Reading raw speed and divergence |
| ROC | Percentage around 0 | No fixed levels | Comparing speed across assets |
| RSI | Bounded 0 to 100 | Fixed 70 / 30 zones | Flagging stretched extremes |
Why Momentum Matters in 2026
Momentum remains a standard study on every major crypto charting platform and a fixture in the oscillator panels of coin analysis dashboards. Its appeal in fast, 24-hour crypto markets is that it gives a transparent read on trend speed with almost no complexity, and the ten-period version keeps its place for short-term and swing analysis.
The modern approach treats it as one confirming layer in a broader toolkit rather than a standalone system, often stacked with a directional tool like the MACD and read as part of an aggregated signal. Newer indicators are refinements of the momentum idea rather than replacements for it, so the core measure stays foundational. As always, it informs decisions and flags shifts in speed, but it forecasts nothing on its own and works best alongside sound risk management.
 Stay Ahead in Crypto