English
  Nederlands
  Deutsch
Key Takeaways
- The VWMA is a moving average that weights each period’s price by its trading volume, so busy, high-volume candles pull the line more than quiet ones.
- Comparing the VWMA to a plain moving average shows whether volume is confirming a trend or quietly abandoning it.
- Its signals are only as trustworthy as the volume data behind them, which makes liquid assets and reputable exchanges essential.
In This Article
Why Volume Belongs in a Moving Average
Most moving averages treat every candle the same. A sleepy Sunday with barely any trading counts exactly as much as a frantic sell-off where billions change hands. That feels wrong, and for good reason: the price levels where the most money actually traded tell you more than the ones nobody cared about. The Volume-Weighted Moving Average, or VWMA, is the fix. It folds trading volume directly into the average so the busiest bars carry the most weight.
Volume is one of the oldest confirmation tools in technical analysis. A breakout on heavy volume is convincing; the same move on thin volume often fades. The VWMA bakes that logic into a single line you can drop straight onto a chart.
The Volume-Weighted Moving Average Explained
The VWMA is a moving average that multiplies each period’s closing price by the volume traded in that period, then divides by the total volume over the lookback window. In plain terms, days when a lot of coins changed hands push the average toward their price, while quiet days barely move it.
The practical result is a line that shifts with market activity. During a high-volume rally the VWMA hugs price closely and reacts fast. During a low-volume drift it smooths out and behaves much like an ordinary average. That quality is what makes it useful: it quietly signals how much conviction sits behind the current move.
Where VWMA Comes From
Unlike some famous indicators, the VWMA has no single documented inventor or launch date. It is a natural extension of the broader moving-average family, built on the long-standing market idea that price levels backed by more volume are more meaningful. Once retail charting platforms such as TradingView added it as a built-in overlay, it became a mainstream tool rather than a niche one.
There is no universal default length either. Traders commonly use a 20-period VWMA for short-term and swing setups, 50 for the medium term, and 200 for long-term trend context, mirroring the lengths used with other moving averages.
How Does VWMA Work?
The mechanics are straightforward arithmetic applied over a rolling window of the last N periods.
The Formula
For each period you multiply the closing price by that period’s volume, add those products together across the window, and divide by the sum of the volumes:
VWMA = (sum of Price x Volume over N periods) / (sum of Volume over N periods)
Every new bar, the oldest period drops off and the newest is added, so the line updates continuously. Because volume sits in both the top and bottom of the calculation, a single very heavy bar can dominate the result while a string of light bars fades into the background.
A Simple Comparison
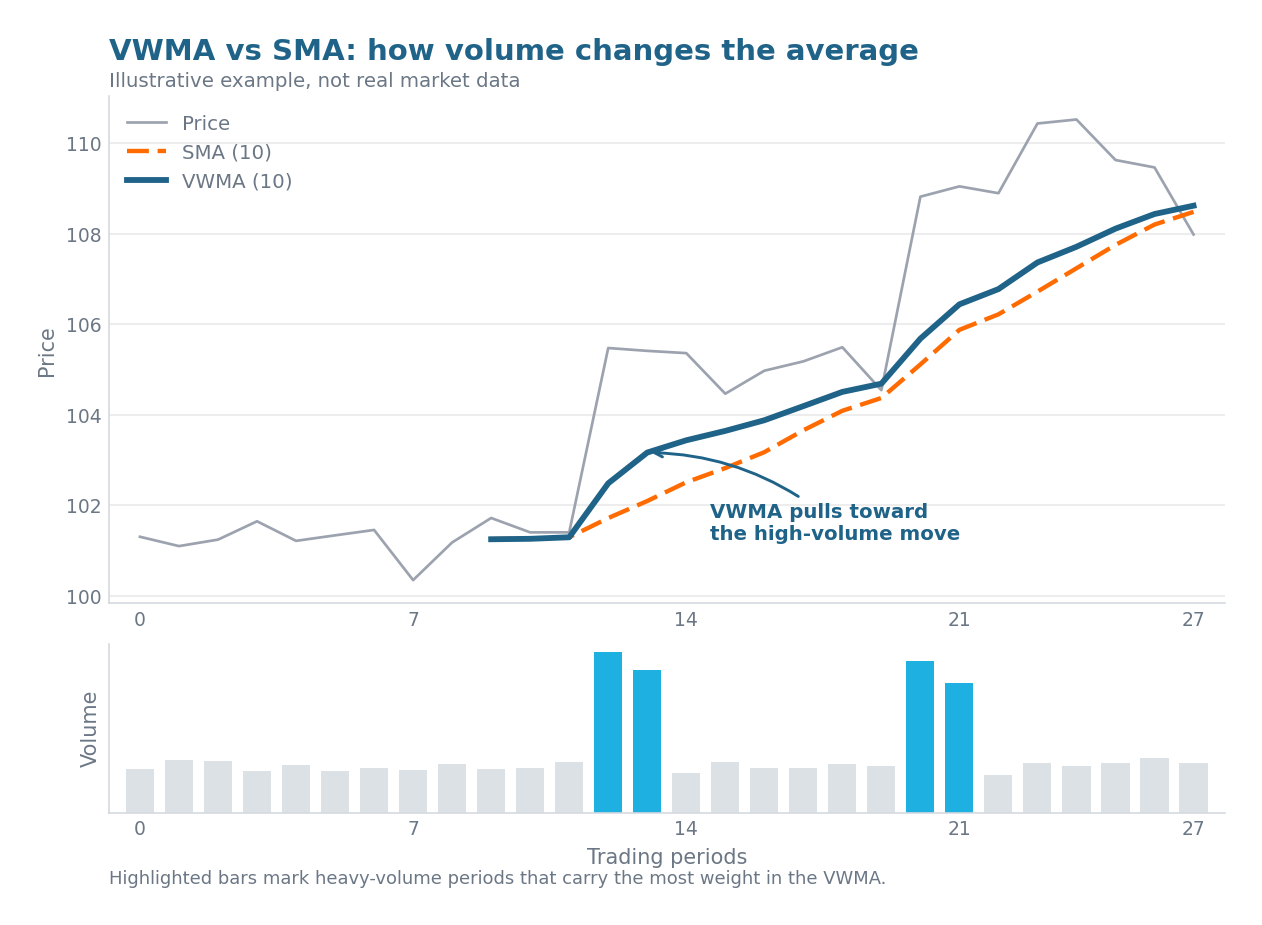
Picture five days where price barely moves but one day sees ten times the normal volume. A simple moving average would treat all five days equally. The VWMA pulls hard toward that one high-volume day, because that is where the real trading happened. When volume is roughly even across the window, the two lines sit close together. When volume is lumpy, they separate, and that gap is itself a signal.
How Crypto Traders Use VWMA
Crypto suits the VWMA well because it trades 24 hours a day with no session gaps, giving the average an unbroken stream of data to work with. Traders lean on it in a few recurring ways.
The most common is trend confirmation. Plotting the VWMA next to a same-length simple average gives a one-glance read: when the VWMA sits above the SMA, the heavy-volume candles are the bullish ones, so volume is backing the uptrend. When it sits below, volume is confirming a decline. A rising VWMA slope says the move has participation behind it.
A second use is spotting divergence. If Bitcoin grinds to a new local high but the VWMA flattens or slips below the SMA, price is climbing on lighter volume, an early warning that the rally may be running out of fuel. Traders also treat pullbacks to the VWMA as dynamic support, since the line marks where the bulk of volume traded. On a coin’s trend outlook, such as the moving-average inputs behind the Cardano price prediction, a VWMA that holds on a pullback is read as a healthier sign than one that breaks decisively.
Benefits of Trading With VWMA
- Reacts quickly to high-conviction moves, because heavy-volume candles pull the line fast.
- Filters out low-volume noise, so quiet off-hours wiggles move the average less.
- Provides built-in volume confirmation when read against a simple moving average.
- Flags weakening trends early when price rises but the VWMA lags or crosses below the SMA.
- Marks participation-based support and resistance zones for pullback entries.
Limitations and Risks
- It is only as good as its volume data, and crypto volume is often distorted by wash trading on unregulated venues.
- Like every moving average, it lags, reacting after a move rather than predicting it.
- It whipsaws in choppy, range-bound markets, producing false crossover signals.
- A single abnormal volume spike from a liquidation cascade or exchange glitch can yank the line.
- Crypto volume is fragmented across hundreds of exchanges, so a VWMA on one feed can differ sharply from one on aggregated data.
VWMA vs SMA, EMA and VWAP
The clean way to remember the moving-average family is by what each one weights. A simple moving average weights nothing, treating every close equally. An exponential moving average weights by recency, favoring newer bars through a decaying multiplier. The VWMA weights by conviction, favoring the bars where the most trading occurred.
The trickier comparison is with VWAP, the Volume-Weighted Average Price, because both use volume and the names look almost identical. They are not the same tool. VWAP is a cumulative session benchmark that resets each day, growing more sluggish as the session fills up, and it is designed for intraday use. The VWMA is a rolling average over a fixed number of periods that never resets and works on any timeframe, from one-minute to weekly charts.
| Feature | VWMA | VWAP |
|---|---|---|
| Window | Fixed rolling N periods | Cumulative from session start |
| Reset | Never resets | Resets each session |
| Timeframe | Any timeframe | Intraday only |
| Typical use | Trend confirmation, dynamic support | Intraday fair-value benchmark |
In short, VWAP answers what the volume-weighted average price has been so far today, while the VWMA answers what it has been over the last N bars as a continuous line. Confusing the two is one of the most common mistakes new traders make.
Why VWMA Matters in 2026
The VWMA remains a standard overlay on every major charting platform and shows up inside countless automated trading strategies, often paired with momentum tools. A popular template combines it with a short exponential average and the RSI oscillator to filter entries, using the VWMA as the conviction gate that confirms a move has volume behind it.
The live issue in 2026 is data quality. As trading shifts toward regulated venues and platforms publish cleaner, adjusted volume figures, VWMA signals on major assets like Bitcoin and Ethereum grow more trustworthy, while readings from thin, unregulated exchanges stay suspect. The takeaway is simple: treat the VWMA as a volume-conviction filter layered on top of price analysis, most reliable on liquid assets with dependable data and always paired with price action rather than used alone. Like any indicator, it informs decisions but never replaces sound risk management.
 Stay Ahead in Crypto