Key Takeaways
- The Ichimoku Cloud is an all-in-one indicator that shows trend, momentum, and support or resistance in a single view.
- It plots five lines built from rolling high-low midpoints, including a forward-projected “cloud” that hints at future support and resistance.
- It works on any market and timeframe, but it shines in clear trends and struggles in choppy, low-volume conditions.
In This Article
Reading the Market at a Glance
Most chart tools answer one question: a moving average shows the trend, an oscillator shows momentum, a line marks support. The Ichimoku Cloud tries to answer all of them at once. Its Japanese name, Ichimoku Kinko Hyo, translates roughly to “one glance equilibrium chart,” and that is the idea: look once and read the balance of the market.
For traders who already lean on technical analysis, Ichimoku packs trend direction, momentum, and dynamic support or resistance into a single overlay. That can feel busy at first, but once the five lines click, the chart becomes easier to read, not harder.
The Five Lines of Ichimoku
Ichimoku is built from five lines, four of which are midpoints of a rolling high-low range rather than averages of closing prices. The default settings are 9, 26, and 52 periods, with a 26-period shift forward and backward.
| Line | What it measures | Default formula |
|---|---|---|
| Tenkan-sen (conversion) | Short-term momentum | (9-period high + low) / 2 |
| Kijun-sen (base) | Medium-term trend | (26-period high + low) / 2 |
| Senkou Span A (leading A) | Front edge of the cloud | (Tenkan + Kijun) / 2, shifted 26 ahead |
| Senkou Span B (leading B) | Back edge of the cloud | (52-period high + low) / 2, shifted 26 ahead |
| Chikou Span (lagging) | Confirmation vs past price | Current close, shifted 26 back |
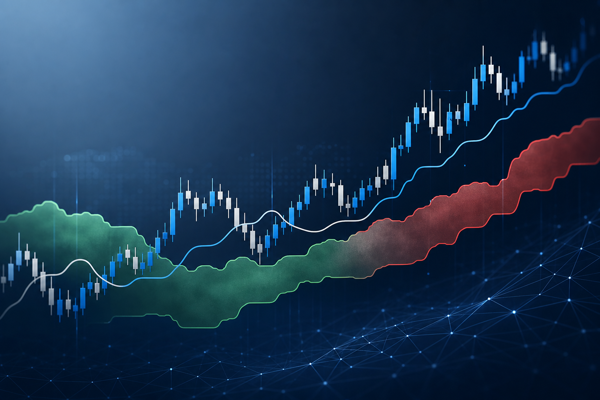
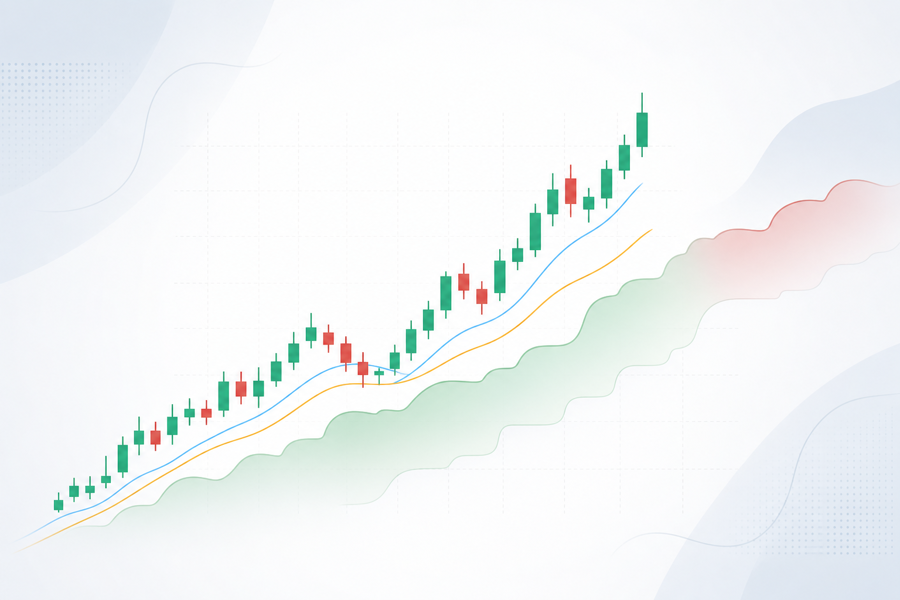
The shaded area between Senkou Span A and Senkou Span B is the Kumo, or cloud. Because both spans are plotted 26 periods into the future, the cloud extends past the latest candle and projects likely support and resistance zones before price gets there. When Span A sits above Span B the cloud is bullish, often drawn green; when Span A is below, it is bearish, often drawn red.
Where Ichimoku Came From
The system was created by Goichi Hosoda, a Japanese financial journalist who wrote under the pen name Ichimoku Sanjin. He began developing it in the 1930s and reportedly spent decades refining the calculations by hand with the help of assistants. He finally published the full method in 1969 as a multi-volume work.
For years the indicator stayed mostly within Japan, partly because of the language barrier. It reached Western traders from the 1990s onward and is now a standard option on nearly every charting platform, including the ones crypto traders use daily.
How to Read the Cloud
The cloud is the first thing to check. Price above the cloud signals a bullish bias, price below it signals a bearish bias, and price inside the cloud means indecision, which many traders treat as a no-trade zone.
The TK cross
When the faster Tenkan-sen crosses above the slower Kijun-sen, it is a bullish momentum trigger. A cross below is bearish. The signal carries more weight when it happens on the right side of the trend: a bullish cross above the cloud is far stronger than the same cross below it.
Breakouts, twists, and confirmation
A Kumo breakout happens when price closes decisively out of the cloud, often marking a trend change. A Kumo twist, where the two leading spans cross and flip the cloud’s color, warns of a possible shift before it arrives. Many traders also wait for the Chikou Span to clear past price action before acting, and pair Ichimoku with a momentum tool like the RSI oscillator to avoid buying into an exhausted move.
Using Ichimoku on Crypto Charts
There is one wrinkle worth knowing. The 9, 26, and 52 defaults were calibrated for the Japanese stock market of the 1930s, which traded six days a week. Crypto trades 24/7 with no weekends or market closes, so the same period counts cover a different stretch of real activity. A trader watching Bitcoin on a daily chart is feeding the indicator continuous data the original design never saw.
Some traders adjust the settings for this, with 10/30/60 and 20/60/120 being the most cited variants, the latter to cut false signals on lower timeframes. Others keep the classic 9/26/52, partly because so many traders watch those exact levels that they become self-reinforcing. There is no settled answer, so backtest both on your own pair and timeframe. Either way, Ichimoku is most reliable on higher timeframes like the 4-hour and daily, where thin altcoin noise does less damage.
Benefits of the Ichimoku Cloud
- Combines trend, momentum, and support or resistance in one overlay, reducing chart clutter.
- The cloud is forward-looking, projecting support and resistance 26 periods ahead instead of only lagging.
- Works on any market and any timeframe, from scalping charts to weekly views.
- Gives an instant, unambiguous read on direction through the simple above, below, or inside the cloud rule.
Limitations to Keep in Mind
- It lags in choppy or sideways markets and produces whipsaws when there is no clear trend.
- Five lines plus a shifted cloud are intimidating for beginners and easy to misread early on.
- Low-volume altcoins and small timeframes generate frequent unreliable signals.
- The defaults were tuned for a six-day stock market, and adjusting them for crypto is itself debated.
- It is a bias filter, not a complete system, and works best alongside volume and other tools.
Ichimoku vs Other Indicators
The Tenkan and Kijun pair behaves like a fast and slow moving average crossover, but Ichimoku adds the forward-projected cloud and the lagging Chikou Span, information a simple average pair cannot show. Against the MACD indicator, both flag momentum shifts through crossovers, yet MACD lives in a separate pane and focuses purely on momentum, while Ichimoku overlays price and also maps trend bias and support or resistance.
The RSI is different again. It is a bounded momentum oscillator that measures whether an asset is overbought or oversold, and it says nothing about direction or price levels. That makes it a natural partner rather than a rival: use Ichimoku for the “which way and where,” then add the RSI for “how stretched.” Pairing a directional tool with a momentum tool is one of the more reliable ways to filter out Ichimoku’s false signals in ranging markets.
Final Thoughts
The Ichimoku Cloud has aged well because it was designed around a timeless goal: read the market quickly and clearly. In 2026 it remains a favorite for crypto traders who want trend, momentum, and structure without juggling four separate indicators. The learning curve is real, but once the five lines make sense, a noisy chart turns into a readable map.
As with any indicator, treat it as one input rather than a crystal ball. Pairing the cloud’s directional bias with volume, momentum confirmation, and the broader context on a coin’s price prediction page gives a far more grounded read than any single signal on its own.
 Stay Ahead in Crypto