English
  Nederlands
  Deutsch
Key takeaways
- The Hull Moving Average (HMA) is a trend-following line built to react quickly to price while staying smooth, cutting the lag that slows down traditional moving averages.
- It nests weighted moving averages: a fast one is doubled and the slower one subtracted to cancel lag, then the result is re-smoothed over the square root of the period.
- The HMA reacts faster but does not predict, and in choppy sideways markets its speed can trigger false signals, so traders pair it with confirmation.
In this article
- The moving average dilemma
- The Hull Moving Average at a glance
- Where the Hull Moving Average came from
- How does the Hull Moving Average work?
- How traders read the Hull Moving Average
- Benefits of the Hull Moving Average
- Limitations to watch
- Hull Moving Average vs SMA, EMA and WMA
- Why the Hull Moving Average matters
The moving average dilemma
Every moving average wrestles with the same compromise. Smoothing price data reveals the underlying trend, but the smoother you make the line, the more it lags behind the current price, because older prices are still being averaged in. A trader who wants an earlier signal shortens the period, and the line turns jumpy and starts firing false alarms. Smooth or fast: pick one.
The Hull Moving Average was designed to refuse that choice and deliver both at once. It sits within the toolkit of technical analysis, the study of price and volume behaviour to judge where a market may be heading, and it has become one of the more popular moving averages for fast markets like crypto.
The Hull Moving Average at a glance
The Hull Moving Average, usually shortened to HMA, is an overlay indicator plotted directly on the price chart, just like any other moving average. Its single job is to track the trend with as little delay as possible while keeping the line clean enough to read at a glance.
It manages this by stacking several weighted averages together in a way that cancels out most of the usual lag. The important caveat is that the HMA is still a lagging indicator: it is calculated entirely from prices that have already happened. It reacts to turns faster than a conventional average, but it does not forecast them, and it is not a crystal ball.
Where the Hull Moving Average came from
The indicator was created in 2005 by Alan Hull, an Australian trader and author with a mathematics background. His stated aim was to solve the age-old problem of making a moving average more responsive to current price while keeping the curve smooth. By his own account he stumbled onto it while working on a different indicator and got sidetracked trying to strip the lag out of a standard average.
The result caught on quickly. The HMA is now a built-in overlay on essentially every major charting platform, which is why you will find it sitting alongside long-established tools despite being a relatively modern invention.
How does the Hull Moving Average work?
The formula looks intimidating but breaks down into three clear steps. Written out, it is HMA(n) = WMA( 2 x WMA(n/2) minus WMA(n) ), smoothed over the square root of n. Here is what each piece is doing.
Weighted moving averages, the building blocks
The HMA is assembled entirely from weighted moving averages, or WMAs, not simple ones. A WMA gives the most recent prices more importance: over an n-period window the newest price is multiplied by n, the next by n minus 1, and so on down to 1 for the oldest, then the total is divided by the sum of those weights. Front-loading the recent data means a WMA already lags less than a simple moving average, which treats every price in the window equally.
Cancelling the lag
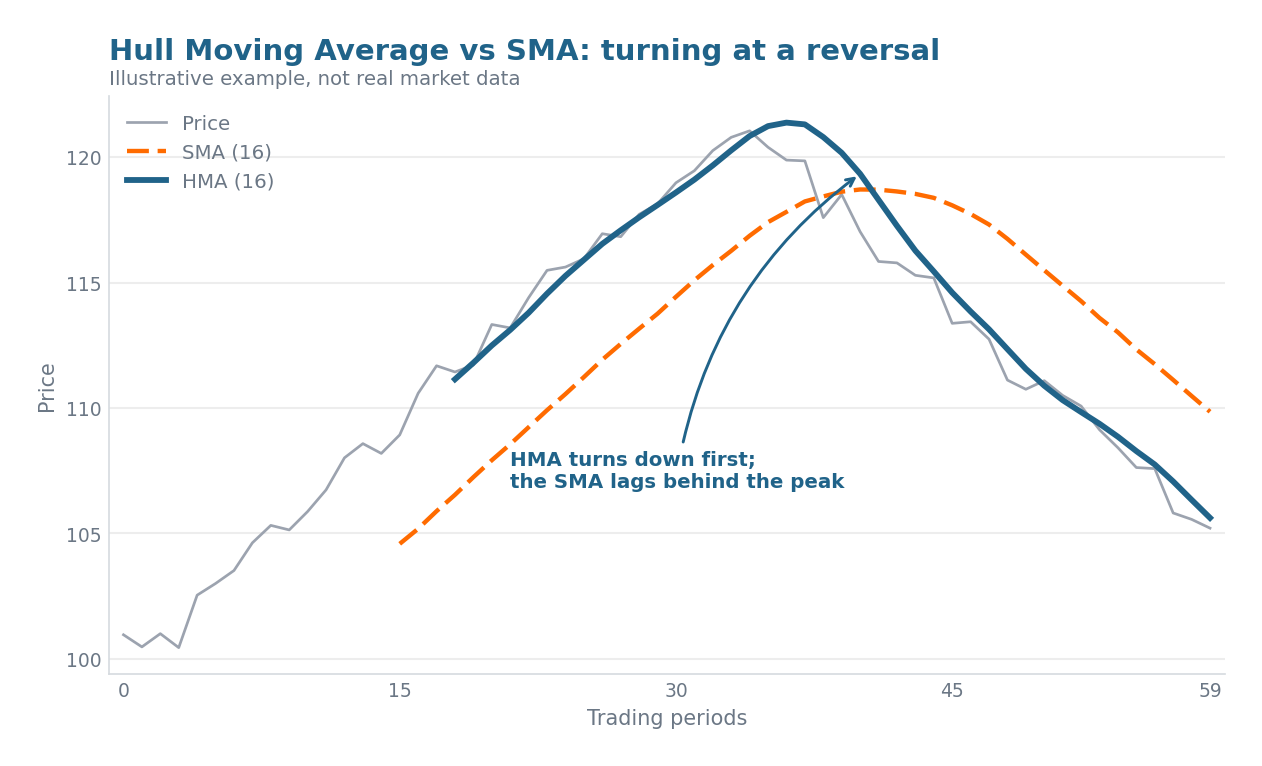
The clever core is the expression 2 x WMA(n/2) minus WMA(n). One WMA is calculated over the full period and a faster one over half the period. The gap between the fast and the slow average is a measure of how far each is trailing the true price. By doubling the fast average and subtracting the slow one, that gap is added back on top, projecting the line forward so it sits almost on the price. The downside is that this raw series is now too choppy to trade directly.
Re-smoothing with the square root
The final step passes that raw series through one more weighted average, but only over the square root of the period rather than the full length. For a 16-period HMA that means smoothing over just 4 periods, because the square root of 16 is 4. Using the square root applies just enough polish to remove the choppiness without dragging the lag back in. Because n/2 and the square root of n rarely land on whole numbers, platforms round them, which is a minor reason the same HMA can read slightly differently across charting tools.
How traders read the Hull Moving Average
Slope is the primary signal. A rising HMA points to an up-trend and a falling HMA to a down-trend, with the steepness of the line read as a rough gauge of momentum. Many platforms colour the line automatically, green when it rises and red when it falls, so a colour flip becomes a visual cue to reassess a position.
Traders also use the HMA as a pure trend filter, taking long setups only when a longer HMA slopes up and shorts only when it slopes down, while a separate tool such as MACD generates the actual entries. A faster HMA crossing a slower one, with 9 and 55 a commonly cited pairing, is used as a trigger too. It is worth knowing that Alan Hull himself argued for trading the turning points rather than crossovers, since crossover methods lean on the very lag the HMA removes, yet the community uses crossovers widely anyway.
Common period settings are conventions, not rules. Short values like 9, 14, 16 and 21 suit fast intraday reads, while 50 to 200 with 55 and 100 often chosen suit swing and position trading. There is no single best number: shorter is faster and noisier, longer is smoother and later, and the right choice depends on the asset, the timeframe and how volatile the market is.
Benefits of the Hull Moving Average
- Low lag: it reacts to trend changes noticeably sooner than an SMA, EMA or WMA of the same length.
- Stays smooth: the square-root smoothing keeps the line clean instead of jagged, unlike other fast averages.
- Easy to read: a clear up or down slope shows direction and rough momentum at a glance.
- Strong trend filter: the uncluttered slope gives a quick read on whether the market bias is up or down.
- Widely available: it is built into most charting platforms with a single adjustable period.
Limitations to watch
- Whipsaws in range-bound markets: the same speed that helps in a trend produces a flurry of false flips when price is going sideways.
- Overshoot: the aggressive lag cancellation can push the line briefly past a sharp turning point, overstating a move.
- Not a standalone system: its signals only mean something when a trend is actually present, so it needs confirmation from another tool.
- Implementation quirks: some custom versions repaint or shift values intra-bar, so it pays to check how your specific version behaves after a candle closes.
- Less intuitive: the nested weighted-average maths is harder to follow than a plain average, which can hide what the line is really doing.
Hull Moving Average vs SMA, EMA and WMA
Ranked from most lag to least, the usual order is the simple moving average, then the exponential moving average, then the weighted moving average, with the Hull Moving Average carrying the least lag of the four while still looking smooth. The trade-off is that the HMA is more sensitive to noise in quiet markets and its calculation is more complex. The same lag differences are why the classic 50-day and 200-day averages behind the golden cross and death cross are slow, deliberate signals, whereas a Hull line is built for early reads.
| Indicator | How it weights data | Lag | Smoothness | Best use |
|---|---|---|---|---|
| SMA | Equal weight to every price in the window | Highest | High, smoothest | Slow, stable long-term trend and baselines |
| EMA | Exponentially decaying weight toward recent prices | Medium-high | Medium-high | General trend following, a common default |
| WMA | Linearly decaying weight, heaviest on the newest price | Medium | Medium, can be choppy | A faster trend read than SMA or EMA |
| HMA | Nested WMAs plus lag cancellation and square-root smoothing | Lowest | High, fast and smooth | Early trend and turn detection, or a trend filter, with confirmation |
Why the Hull Moving Average matters
Crypto trades around the clock with no session breaks and frequent sharp moves, so trends can start and reverse in hours. A slow average can leave a trader confirming a move only after much of it has already played out. A low-lag line like the HMA narrows that gap, which is a large part of why fast-reacting moving averages are popular with crypto traders.
In practice the HMA works best as one directional input among several rather than a signal generator on its own. Its clean up or down slope can feed a technical dashboard or sit alongside the indicators on a coin’s price-prediction page, helping frame the current trend bias. Just remember what it is and is not: it reacts faster than older averages, it whipsaws when the market has no trend, and it never predicts price. Treated as a trend tool with confirmation, not a forecast, the Hull Moving Average earns its place on a crypto chart.
 Stay Ahead in Crypto