
Key Takeaways
- A Golden Cross is bullish: the 50-day moving average crosses up through the 200-day moving average, often marking the start of a sustained uptrend.
- A Death Cross is the bearish mirror: the 50-day crosses down through the 200-day, signaling a potential long-term downtrend.
- Both signals are most reliable on daily charts and only when volume and momentum indicators like RSI or MACD confirm the move.
In This Article
The Golden Cross and Death Cross are two widely used technical indicators in trading. They help traders gauge longer-term market direction: a Golden Cross signals an upcoming bull market, while a Death Cross warns that a bear market may follow.
Both indicators are based on moving averages, which smooth out price data over a set period to highlight the underlying trend. They represent the crossover between a short-term moving average and a long-term moving average. The crossover matters because it suggests a potential trend reversal that traders use to decide when to buy or sell.
Golden Cross: The Bullish Indicator
The Golden Cross is a bullish signal that occurs when a short-term moving average crosses above a long-term moving average. The most commonly used pair is the 50-day moving average (MA) and the 200-day moving average. The crossover suggests that market momentum is shifting to the upside.
When a Golden Cross forms, it often marks the start of a long-term uptrend. Traders typically read it as a sign to enter long positions or accumulate, expecting price to keep rising. The Golden Cross is a strong bullish signal, but it does not guarantee that the market will keep climbing indefinitely.
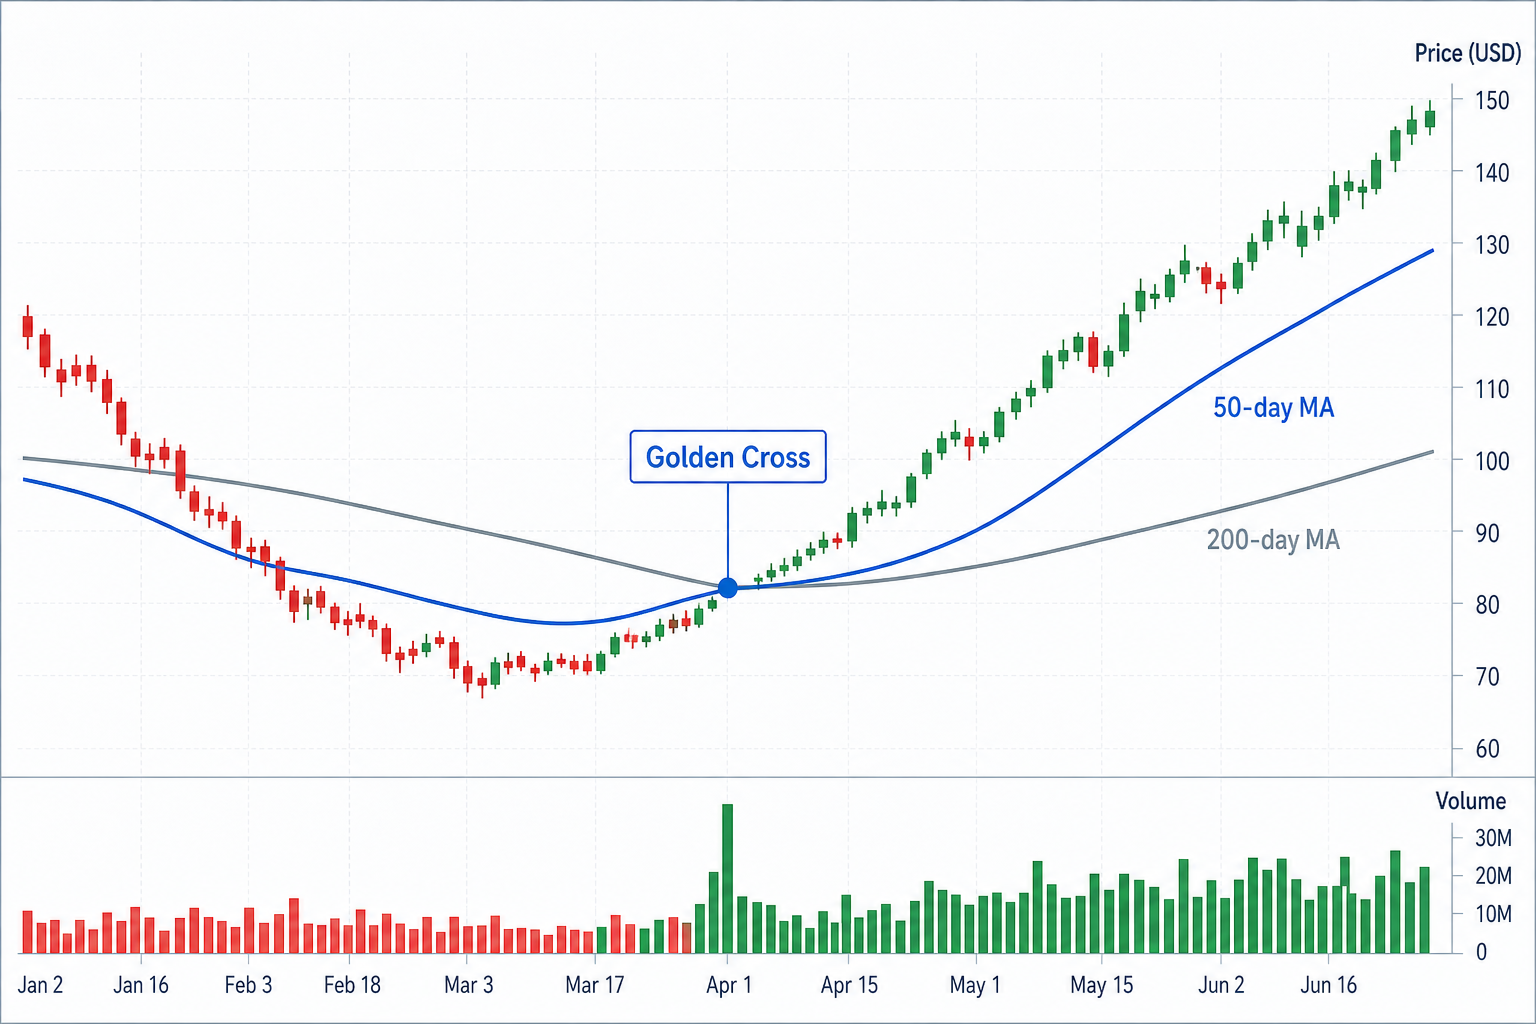
- Occurs when the short-term moving average (for example the 50-day MA) crosses above the long-term moving average (for example the 200-day MA).
- Marks a shift from a downtrend to an uptrend, suggesting increasing bullish sentiment.
- Used in stocks, forex, and crypto markets to flag sustained upward momentum.
- Traders typically read it as a signal to buy or hold, anticipating higher prices.
Death Cross: The Bearish Indicator
The Death Cross is the opposite of the Golden Cross and counts as a bearish signal. It occurs when a short-term moving average crosses below a long-term moving average. Typically the 50-day MA crosses below the 200-day MA, signaling a potential downtrend.
The Death Cross suggests the market may be entering a long-term bear phase, where prices are likely to fall further. Traders often see it as a sign to sell or short, since the downtrend is expected to continue. Like the Golden Cross, the Death Cross is no guarantee; markets can rebound or reverse after the pattern forms.
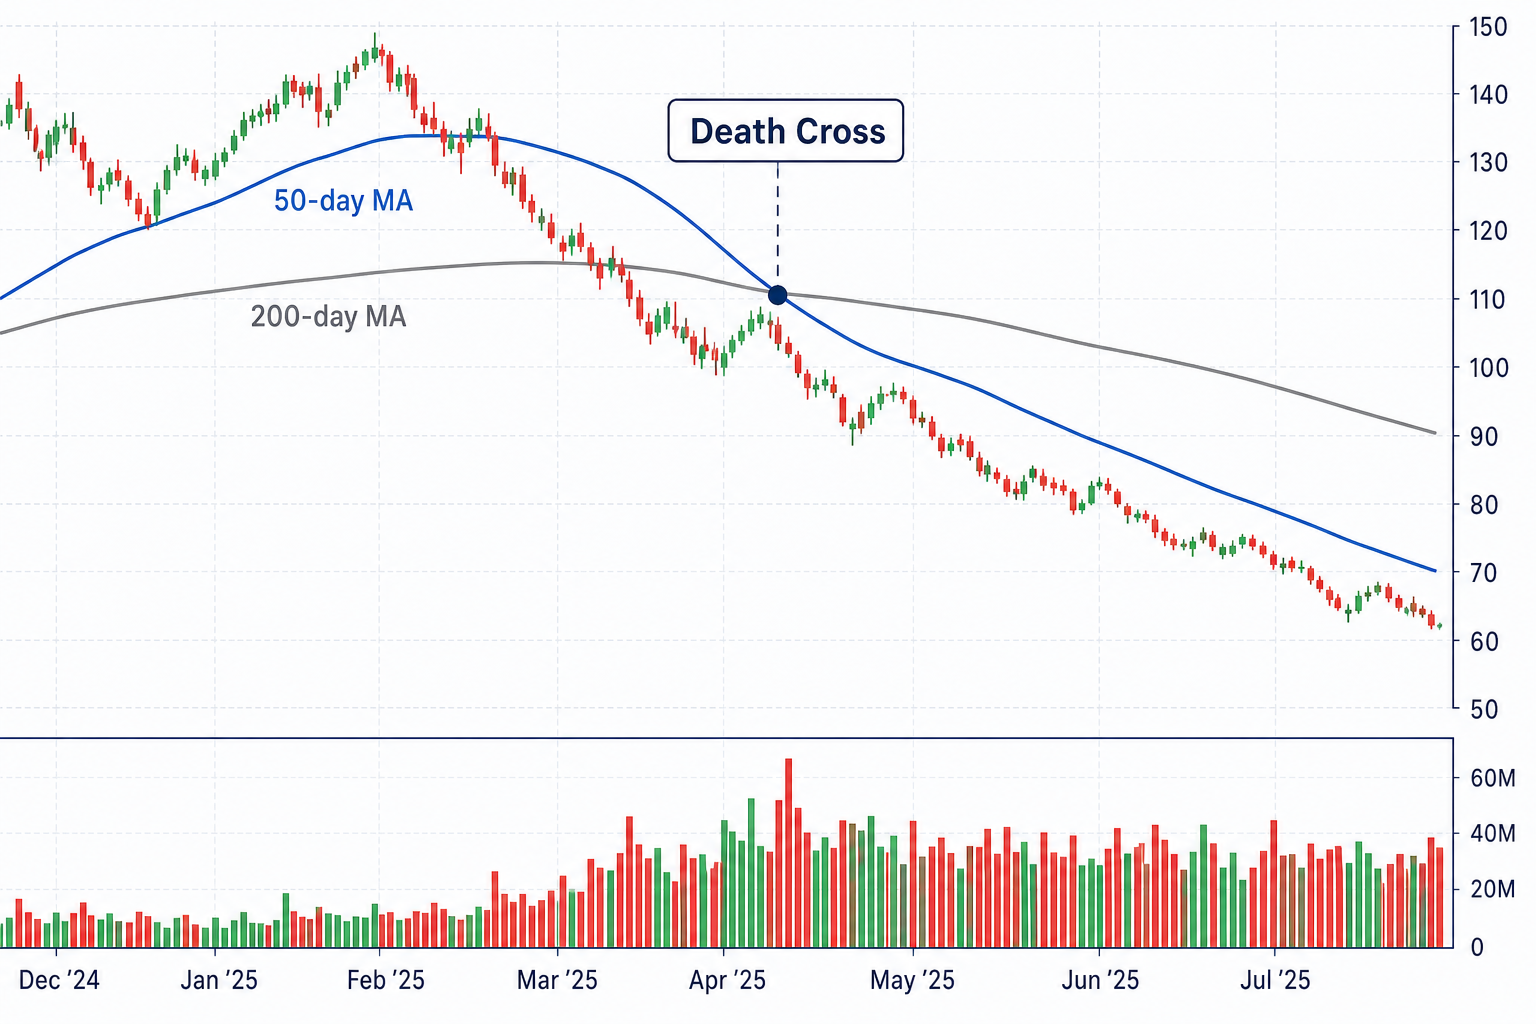
- Occurs when the short-term moving average (for example the 50-day MA) crosses below the long-term moving average (for example the 200-day MA).
- Marks a shift from an uptrend to a downtrend, suggesting increasing bearish sentiment.
- Traders typically read it as a signal to sell or avoid buying, anticipating lower prices.
- Popular signal in stocks, forex, and cryptocurrencies for flagging potential downtrends.
Volume Confirmation
For both the Golden Cross and Death Cross, volume plays a crucial role in confirming the strength of the move. High trading volume during the crossover shows market participants are actively backing the new trend. Without volume confirmation, crossovers can be unreliable and produce false signals.
- Golden Cross: stronger when accompanied by high buying volume. The volume shows investor interest and reinforces the upward trend.
- Death Cross: gains reliability when accompanied by high selling volume. The volume signals that the bearish trend is likely to continue.
Time Frames
Golden Crosses and Death Crosses are most reliable on long-term time frames, such as daily charts. The 50-day MA and 200-day MA are the most common moving averages for these signals. Traders can also apply them to shorter time frames for more frequent signals, but those tend to be less reliable.
- Daily chart: the 50-day and 200-day MAs on a daily chart are the most-used combination, giving a clear view of long-term trends.
- Shorter time frames: some traders apply the crossovers to 5-minute or 15-minute charts for day trading, but these signals are prone to false positives due to market noise.
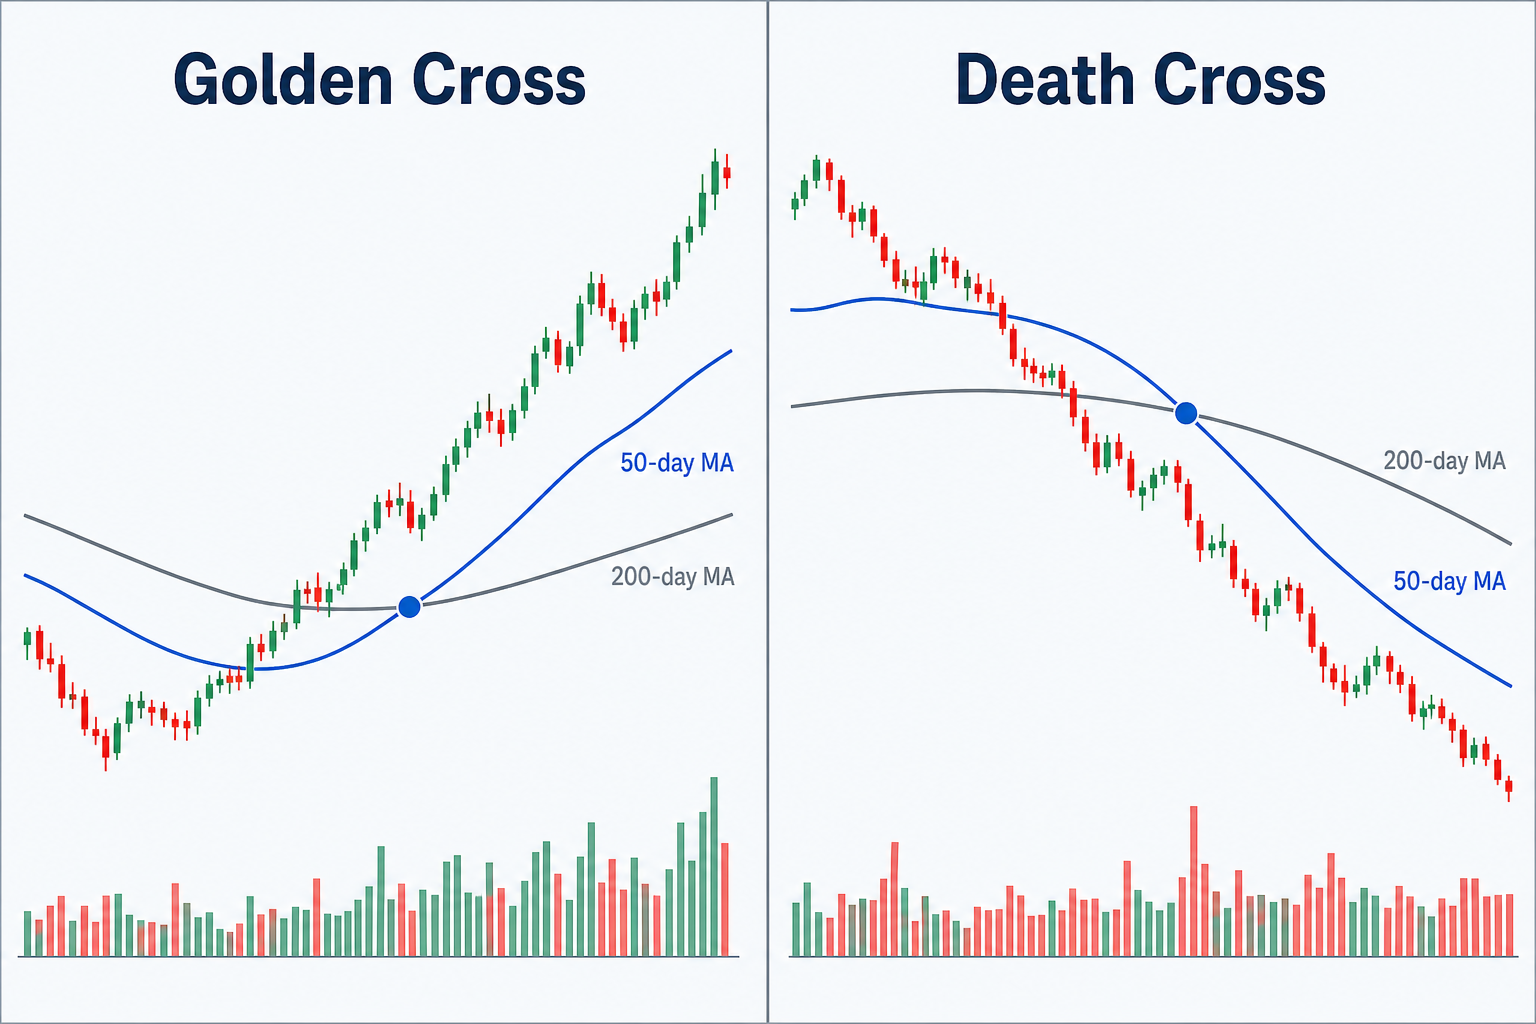
Golden Cross vs Death Cross: Which Is More Reliable?
Both crossovers offer useful insight into market trends, but neither is foolproof. Their reliability rises sharply when paired with additional indicators like RSI (Relative Strength Index) or MACD (Moving Average Convergence Divergence). Traders use these alongside the crossovers to confirm momentum.
- Golden Cross reliability: typically holds up best during sustained uptrends. In volatile or sideways markets, it may not lead to a long-term trend.
- Death Cross reliability: works best in strongly trending bear markets. In choppy or sideways markets, it can fire false signals.
Using the Crossovers in Strategies
Both the Golden Cross and Death Cross deliver important signals for traders, particularly those focused on long-term trends. They are used to flag major market shifts and help decide when to enter or exit positions. Combining them with other technical indicators is what makes them dependable and reduces false starts.
For long-term investors, a Golden Cross can present a clean buying opportunity, while a Death Cross can flag the time to sell or short. In either case, volume and other technical indicators should be checked before acting on the signal.
Using Golden and Death Crosses alongside other analysis tools helps traders make more informed decisions and navigate both bullish and bearish market phases with confidence.
 Stay Ahead in Crypto