English
  Nederlands
  Deutsch
Key takeaways
- Williams %R is a momentum oscillator that shows whether price is closing near the top or the bottom of its recent range, on a scale of 0 to -100.
- Readings above -20 flag overbought conditions and readings below -80 flag oversold ones, but in a strong trend the line can sit at an extreme without reversing.
- It is almost identical to the Fast Stochastic oscillator, so traders confirm it with a different tool such as RSI or a moving average rather than doubling up.
In this article
Why traders watch where price closes
Every candle carries a high, a low, and a close. The high and low show how far price travelled, but the close is where the session’s fight actually ended: near the top means buyers finished in control, near the bottom means sellers did. Williams %R stretches that idea across a whole window of candles, turning “where is price closing inside its recent range?” into a single number you can read at a glance.
It belongs to the same family of momentum tools as the rest of technical analysis: indicators that measure the pressure behind a move rather than the price itself. That makes it useful for timing entries and for spotting when a run is running out of steam.
What Williams %R measures
Williams %R, also written Williams Percent Range or simply %R, is a bounded momentum oscillator. It compares the current closing price to the entire high-to-low range of the last N periods, where the default lookback is 14. The output is pinned between 0 and -100 and never leaves that band, no matter how violently price moves.
The reading tells you position, not direction of travel. Near 0, price is closing at the very top of its recent range; near -100, at the very bottom; -50 is the midpoint. The “Range” in the name is literal: dividing by the full trading range of the window is what keeps the scale consistent from one asset to the next.
Where it started
The indicator comes from Larry Williams, a US futures trader who introduced it in the early 1970s. His original version used a 10-day lookback rather than today’s default of 14, and plotted it on a flipped 0-to-100 scale where 100 marked the oversold extreme. The modern convention multiplies the raw ratio by -100 instead, so charts now run the oscillator from 0 down to -100: the same idea displayed the other way up. Williams treated it as a timing tool inside a broader method, never a standalone system to trade blindly off a single extreme.
How does Williams %R work?
The formula
The calculation needs only three inputs over the lookback window: the highest high, the lowest low, and the current close.
%R = (Highest high – Close) / (Highest high – Lowest low) × -100
The numerator measures how far the current close sits below the top of the range. The denominator is the full range of the window. Divide one by the other and you get a ratio from 0 (the close is right at the top) to 1 (the close is right at the bottom).
The inverted 0 to -100 scale
Multiplying that ratio by -100 does two things. It turns the decimal into a percent, and the negative sign flips the reading so that 0 sits at the top of the panel and -100 at the bottom. A close near the high produces a value near 0, a close near the low produces a value near -100, and a close in the middle lands around -50. Because the denominator is always the full range, the line can never break outside the 0 to -100 band.
How traders read Williams %R
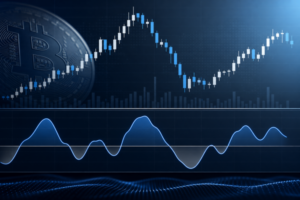
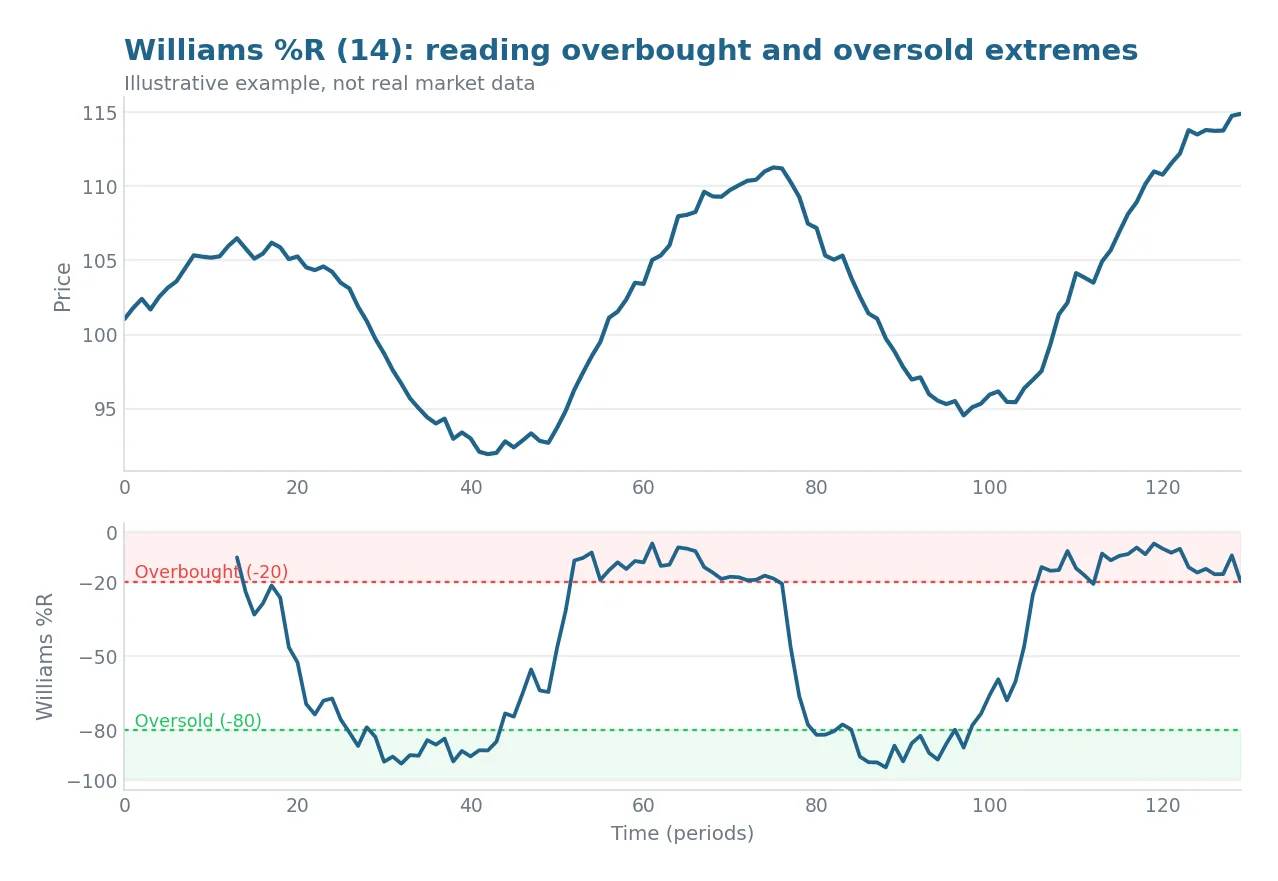
Most traders watch three things: the extreme bands, the midline, and the shape of the line as it turns. The chart below shows how %R swings between its overbought and oversold zones as price rises and falls.
Overbought, oversold and the -50 midline
Readings above -20 are treated as overbought, meaning price is closing near the top of its range. Readings below -80 are treated as oversold. The -50 line works as a bias filter: above it, price is trading in the upper half of its range and momentum leans bullish; below it, the lower half and bearish. On a fast-moving coin like Avalanche, many traders wait for the line to cross back through -50 before acting on an extreme rather than buying the first touch of -80.
Failure swings and divergence
Williams rated the failure swing as his most reliable signal. It happens when the line pushes into an extreme, pulls back, then fails to reach that extreme again on its next attempt before reversing, hinting that the pressure behind the move is fading. Divergence works on the same logic: price makes a new high or low but the oscillator does not confirm with its own new extreme, which can warn of a coming reversal.
When extremes keep trending
The biggest trap is assuming an extreme means a reversal. In a strong trend the line can pin at -100 or 0 for long stretches while price keeps going, so an oversold reading inside a healthy uptrend often signals continuation, not a bottom. This is why the indicator shines in ranging markets and misleads in trending ones. Williams’ own rule built in patience: wait for the extreme, let five trading days pass, then require the oscillator to return to that extreme before taking the trade.
Williams %R vs Stochastic and RSI
Williams %R is often grouped with the Stochastic Oscillator and RSI, but its relationship to each differs sharply. Against the Fast Stochastic %K it is not merely similar, it is the same calculation: the two anchor to opposite ends of the range, but the -100 multiplier flips that inversion back, so %R and Fast %K move in the same direction with an identical shape. The exact relationship is %R = %K – 100, so a %R of -20 is precisely a %K of 80. In practice %R is a Fast Stochastic without the smoothing signal line, which means running both and calling their agreement “confirmation” just counts the same signal twice.
RSI is a genuinely different indicator. It ignores the high-low range entirely and instead measures the ratio of average gains to average losses, so it tracks the velocity of price change rather than position within a range. It is more heavily smoothed, moves slower, and centres on its 50 line. Because %R and RSI measure different things, they actually complement each other.
| Feature | Williams %R | Stochastic (Fast %K) | RSI |
|---|---|---|---|
| Measures | Close vs the highest high of the range | Close vs the lowest low of the range | Average gains vs average losses |
| Scale | 0 to -100 (inverted) | 0 to 100 | 0 to 100 |
| Overbought / oversold | -20 / -80 | 80 / 20 | 70 / 30 |
| Smoothing | None, fastest | %D signal line (SMA of %K) | Built-in Wilder smoothing |
| Signal line | None | Yes (%D) | None |
Using Williams %R in crypto markets
Crypto trades 24/7, so there are no session gaps and the “period” is simply whichever candle interval you choose. The calculation is identical to how it is applied in equities or forex; what changes is behaviour. Crypto is volatile and prone to long, persistent trends, so the pinning problem is more pronounced and fading every -20 or -80 touch is a fast way to lose money.
The common fixes are to read the oscillator on higher timeframes such as the 4-hour or daily to cut noise, and to pair it with a different family of tool rather than a redundant one. Combining %R with a trend filter like a moving average, or with a momentum indicator such as MACD, gives confirmation that a second range oscillator cannot. Taking bias from a higher timeframe and entries from a lower one suits round-the-clock crypto markets well.
Benefits of Williams %R
- Fast and sensitive: with no smoothing lag, it reacts to the newest close immediately and flags turns early.
- Bounded and normalized: it always reads 0 to -100 regardless of price or volatility, so readings compare cleanly across coins and timeframes.
- Simple, transparent math: it needs only high, low, and close plus one lookback setting.
- Strong in ranges: it is well suited to mean-reversion timing inside an established trading range.
Limitations to keep in mind
- Whipsaws in trends: the same speed that catches turns early also fires false signals during strong directional moves.
- Pins at extremes: it can sit at -100 or 0 for long periods in a persistent trend, so overbought does not mean bearish.
- Noisy on low timeframes: the lack of smoothing produces jitter on short intervals and in thin, illiquid pairs.
- Not standalone: it is derived from past price only and needs a trend filter or a second, different indicator for confirmation.
Why Williams %R matters
Williams %R has stayed on every major charting platform for half a century because it does one job cleanly: it shows, without lag, where price is closing inside its recent range. Its niche is short-term timing and mean reversion in ranging conditions, where reacting quickly is an advantage.
The discipline that makes it work is the one Williams built into his original rule. Treat an extreme as an alert that needs confirmation, whether that is a cross back through -50, a failure swing, a divergence, or agreement from a trend filter, and never as a standalone order. Read that way, it earns its place alongside indicators like RSI and MACD in the signal mix on a coin’s price-prediction page, helping time an entry the broader trend has already justified.
 Stay Ahead in Crypto