English
  Nederlands
  Deutsch
Key Takeaways
- The ADX measures how strong a trend is, not which direction it points, on a scale from 0 to 100.
- It travels with two companion lines, +DI and -DI, which supply the bullish or bearish direction that ADX itself leaves out.
- A reading above roughly 25 signals a trending market worth following, while a low reading warns that trend signals are likely to fail.
In This Article
Why Trend Strength Matters
Most trading tools try to tell you which way price is heading. Far fewer tell you whether the market is going anywhere at all. That distinction matters, because a trend-following strategy that thrives in a strong rally gets shredded in a flat, choppy market. Knowing how much conviction sits behind a move is often more useful than guessing its direction.
The Average Directional Index, or ADX, exists to answer exactly that question. It is a core building block of technical analysis, designed to grade the strength of a trend so you know whether the other signals on your chart are worth trusting.
The Average Directional Index Explained
The single most important thing to understand about the ADX is that it measures trend strength, not direction. A powerful uptrend and a powerful downtrend can both produce a high ADX reading. The line only tells you how strong the trend is, never which way it points.
Because of that, the ADX is almost never used alone. It is the headline member of a three-line system called the Directional Movement Index. The ADX line grades trend strength from 0 to 100, while two companion lines, the positive directional indicator (+DI) and the negative directional indicator (-DI), supply direction. When +DI sits above -DI, buyers are in control; when -DI is on top, sellers dominate.
Where ADX Comes From
The ADX was created by J. Welles Wilder Jr., an American mechanical engineer turned trader, and introduced in his 1978 book New Concepts in Technical Trading Systems. That same book gave traders several tools still in daily use, including the Average True Range, the Parabolic SAR, and the RSI oscillator.
Wilder built these methods by hand, before personal computers, for commodity futures using end-of-day data. The ADX predates modern 24-hour markets by decades, which partly explains why it leans on heavy smoothing and needs a long run of data before its readings settle.
How Does ADX Work?
You do not need the full arithmetic to use the ADX, but the logic behind it is worth understanding. It flows through a few conceptual stages.
True Range and Directional Movement
First, it measures how far price moved each period using True Range, which captures the size of a move while ignoring direction. Next it works out directional movement: how much higher today’s high is than yesterday’s (+DM) versus how much lower today’s low is than yesterday’s (-DM), and the larger expansion wins for that period. These values are smoothed over 14 periods, Wilder’s default, and turned into the +DI and -DI lines as percentages.
From DX to ADX
The system then measures how far apart the two DI lines are. When they are widely separated, one side dominates and the market is trending; when they sit close together, buyers and sellers are balanced and there is no real trend. That separation becomes the DX value:
DX = ( |(+DI) – (-DI)| / ((+DI) + (-DI)) ) x 100
Finally, the ADX is a smoothed average of DX over 14 periods. That extra layer of smoothing is why the ADX is steadier, and slower to react, than the raw numbers underneath it.
How to Read the ADX
The conventional way to read the ADX line uses a few rough bands. Below about 25, the trend is weak or absent and the market is ranging. Above 25, a trend is present and worth respecting; above 50 marks a very strong trend, and readings above 75 are rare. Treat these as a spectrum, not hard tripwires, since assets and timeframes differ and some traders use 20 or 40 as their cutoff.
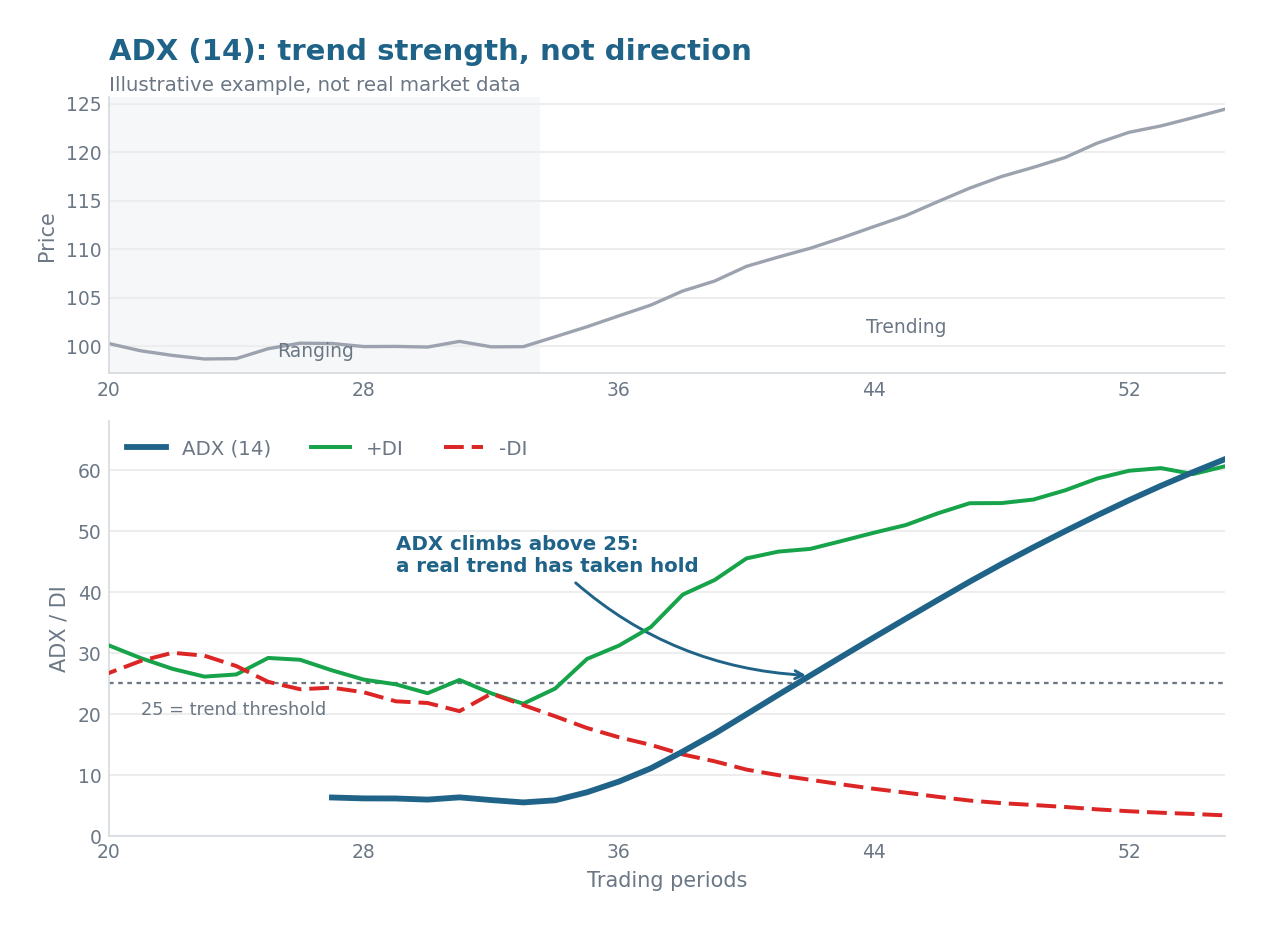
Direction comes only from the DI lines: +DI above -DI is a bullish bias, -DI above +DI is bearish. The slope matters too. A rising ADX means the trend is strengthening, while a falling ADX means it is losing steam. A low but rising reading can flag an emerging trend before it crosses 25, which is one reason a low ADX is a useful warning to distrust moving average crossovers and other trend signals until strength builds.
How Crypto Traders Use ADX
Crypto suits the ADX well, because these markets swing sharply between explosive trends and long stretches of brutal chop, exactly the regime problem the indicator was built to diagnose. On assets like Bitcoin, Ethereum, and Cardano, traders lean on it in a few recurring ways.
The flagship use is matching a strategy to the market. When the ADX is high and rising, traders favor trend-following tactics that ride momentum. When it is low, they switch to range tactics that fade extremes near support and resistance, so the ADX acts as a switch for which playbook applies. It also works as a breakout filter: a move out of a range with a rising ADX above 25 is treated as genuine, while the same move on a flat ADX is viewed with suspicion. On coin analysis dashboards, such as the trend inputs behind the Cardano price prediction, the ADX often contributes the “is there a trend, and how strong” part of an overall signal score.
Benefits of the ADX
- Turns a vague “does this look trendy” judgment into an objective score from 0 to 100.
- Filters out choppy, sideways markets where trend and breakout signals tend to fail.
- Works the same way across any asset and any timeframe.
- Pairs cleanly with direction tools without duplicating what they do.
- Helps traders switch between trend-following and range strategies to fit conditions.
Limitations and Risks
- It lags, confirming trends after they begin rather than predicting them.
- On its own it shows no direction, so a strong crash and a strong rally look identical.
- The DI lines can whipsaw in indecisive markets, producing late or false crossovers.
- The 25, 50, and 75 levels are conventions, not fixed rules, and vary by asset and timeframe.
- A slow, grinding trend can keep the reading low even while price steadily moves.
ADX vs RSI and MACD
The ADX is easy to confuse with other indicators, so it helps to line them up by the question each one answers. The RSI, another Wilder tool on the same 0 to 100 scale, measures momentum and flags overbought or oversold conditions. The ADX measures trend strength. The two work together: a high, rising ADX warns that an overbought RSI may simply reflect a strong trend that keeps running, so fading it is risky.
The comparison that matters most is with the MACD. The MACD is built from moving averages and shows trend direction and momentum, answering which way the market is going. The ADX answers how strongly it is going, if at all. They are complementary rather than competing.
| Indicator | What it measures | Question it answers |
|---|---|---|
| ADX | Trend strength (no direction) | How strong is the trend? |
| MACD | Trend direction and momentum | Which way is price going? |
| RSI | Momentum, overbought/oversold | Is the move overextended? |
A useful way to picture it: the MACD is the steering wheel that points the direction, while the ADX gauges how much force is behind the move. Many traders therefore act on MACD crossovers only when the ADX confirms a trend is genuinely present, since a strong signal on a weak ADX often stalls in the range.
Why ADX Matters in 2026
Nearly five decades after its introduction, the ADX remains a standard option on essentially every serious crypto charting platform and on many coin analysis dashboards. Its staying power comes from solving a problem that never goes away: telling trending markets apart from ranging ones. As more traders run automated strategies, ADX-style filters are commonly embedded as a gating condition, so a trend model only fires when strength is confirmed.
The modern pattern is to use the ADX as one input among many in a broader technical scorecard rather than a solo signal. That is the right way to think about it in 2026: a dependable diagnostic for market conditions, not a crystal ball. Because it lags by design, it confirms trends rather than forecasting them, and like any indicator it informs decisions without replacing sound risk management.
 Stay Ahead in Crypto