
Key Takeaways
- Ascending triangles form during uptrends with flat resistance and rising support, signaling a likely upward breakout when buyers absorb supply at the same price.
- Descending triangles form during downtrends with flat support and falling resistance, signaling a likely downward breakdown when sellers grind buyers out of a level.
- The pattern is only confirmed once price closes outside the trendline on rising volume, ideally on a higher timeframe and with a supporting indicator like RSI or MACD.
In This Article
- Understanding the Triangle Chart Pattern
- Key Features of Triangle Patterns
- The Ascending Triangle: Bullish Continuation
- The Descending Triangle: Bearish Continuation
- Symmetry and Pattern Confirmation
- Differences Between Ascending and Descending Triangles
- Chart Timeframes and Triangle Reliability
- Practical Trading Tips
- Common Mistakes to Avoid
- Triangle Patterns in Technical Analysis
Traders worldwide rely on technical analysis to forecast price movements, and among the most-used tools are ascending and descending triangles. These patterns help identify potential continuations or reversals during periods of price consolidation.
Triangles form as buyers and sellers fight for control and price moves inside a narrowing range. Traders watch these setups to prepare for likely breakouts or breakdowns, and the formations give a clean visual cue for market momentum and likely direction.
Understanding the Triangle Chart Pattern
Triangle patterns emerge on price charts when trendlines converge to form a triangle shape, as price action narrows between a resistance and a support zone. Traders use them to spot high-probability setups during market consolidation. There are two primary triangle types:
- Ascending triangle: bullish pattern with flat resistance and rising support.
- Descending triangle: bearish pattern with flat support and falling resistance.
Each type reflects different market dynamics and possible outcomes. They are not guarantees, but they raise the probability on otherwise-mechanical setups.
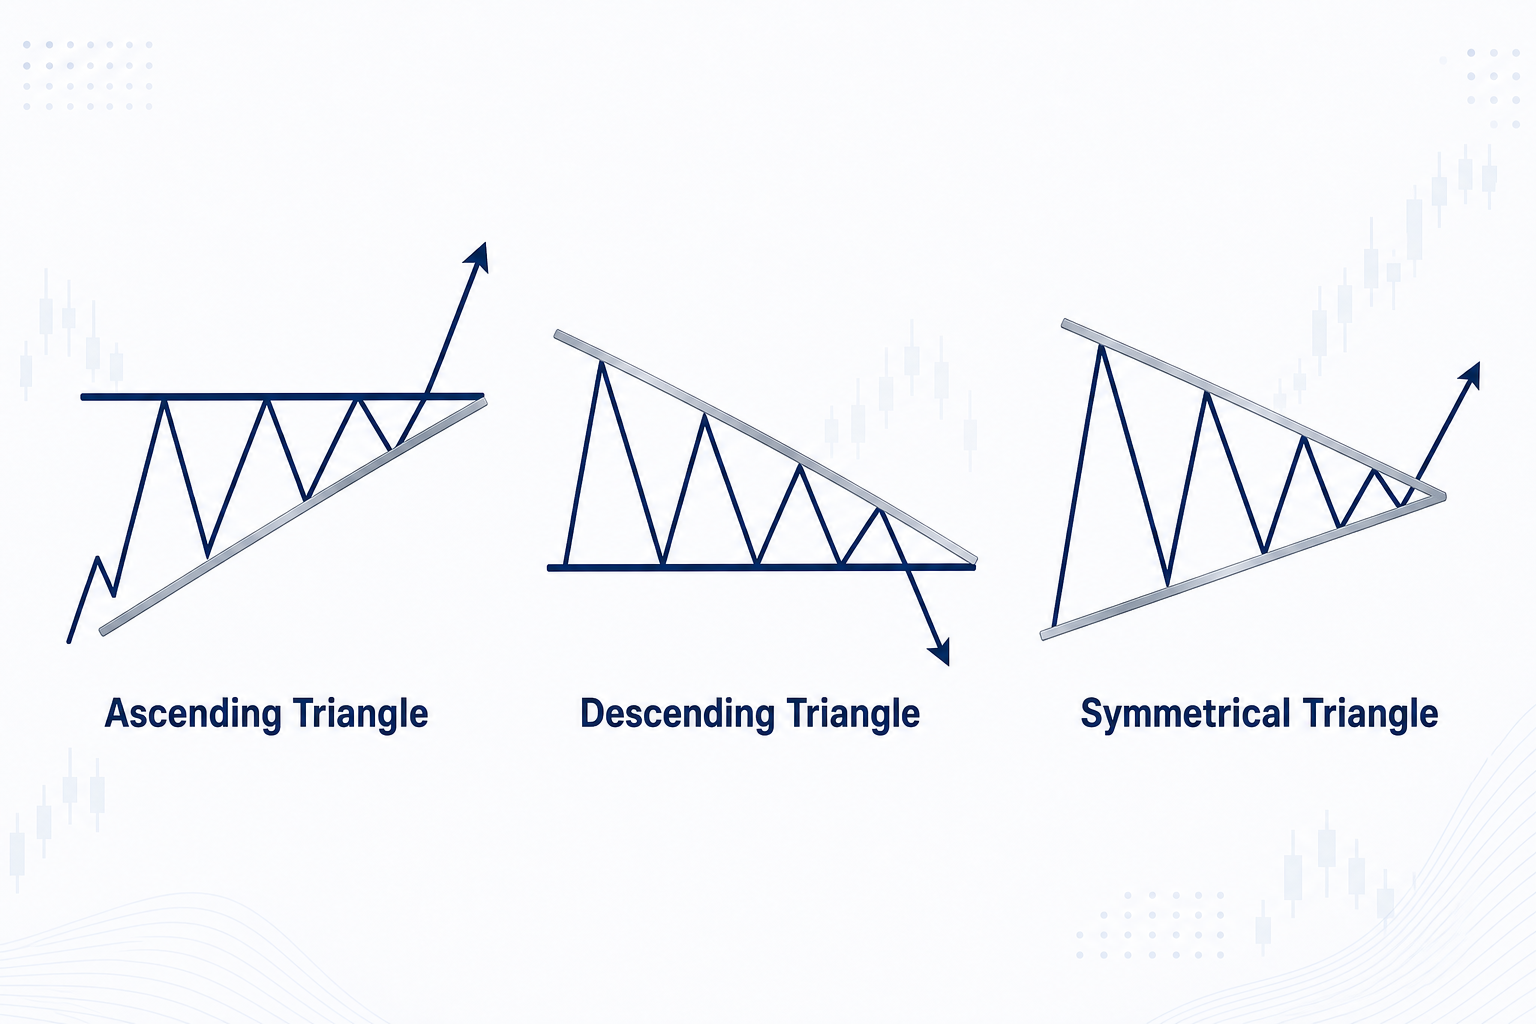
Key Features of Triangle Patterns
Traders identify triangle patterns using a small set of characteristics:
- Support and resistance lines: ascending triangles have flat resistance and rising support; descending triangles have flat support and falling resistance.
- Volume behavior: volume typically declines while the pattern forms, then spikes on breakout to confirm the move.
- Breakout direction: ascending triangles usually break upward; descending triangles often break downward.
These patterns help plan trades, but confirmation is always needed before acting on them.
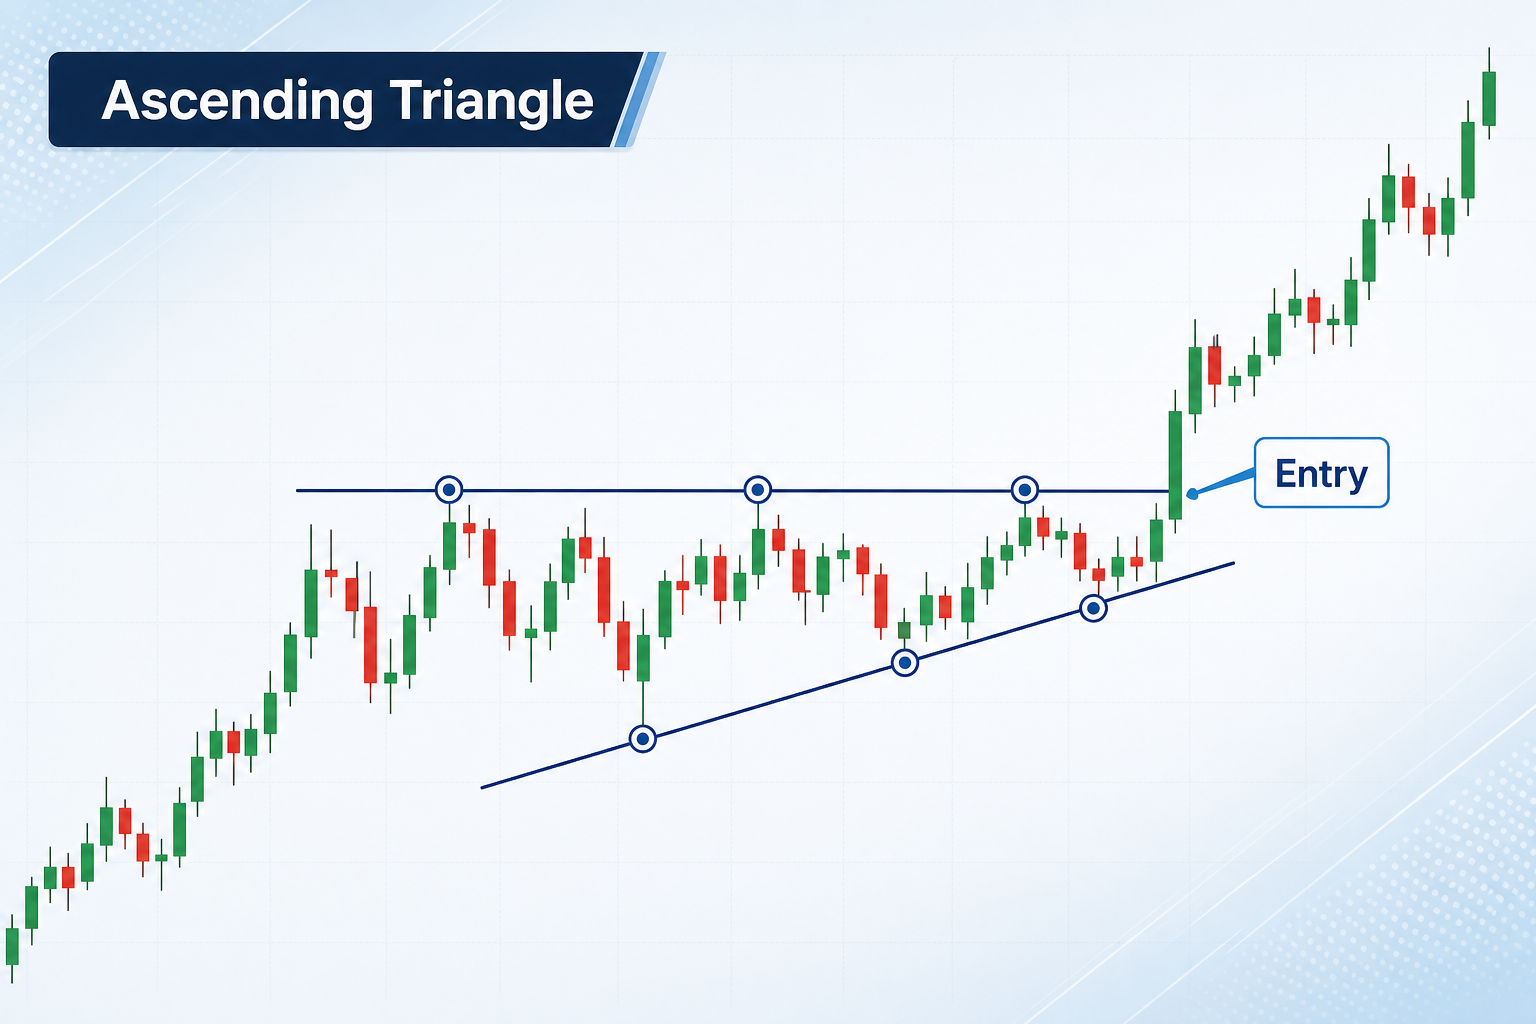
The Ascending Triangle: Bullish Continuation
An ascending triangle forms during an uptrend when buyers gradually gain strength. Price tests a resistance level repeatedly but prints higher lows over time, which shows demand keeps rising as buyers push prices higher.
Structure
- Flat resistance line connects equal highs.
- Rising support line connects higher lows.
- Volume contracts during formation, then spikes on breakout.
Trading the pattern
- Entry: place a buy order just above resistance.
- Stop-loss: set it below the rising support line.
- Take profit: measure the triangle’s height and project it above the breakout point.
Traders consider ascending triangles high-probability bullish setups, but confirmation is still required.
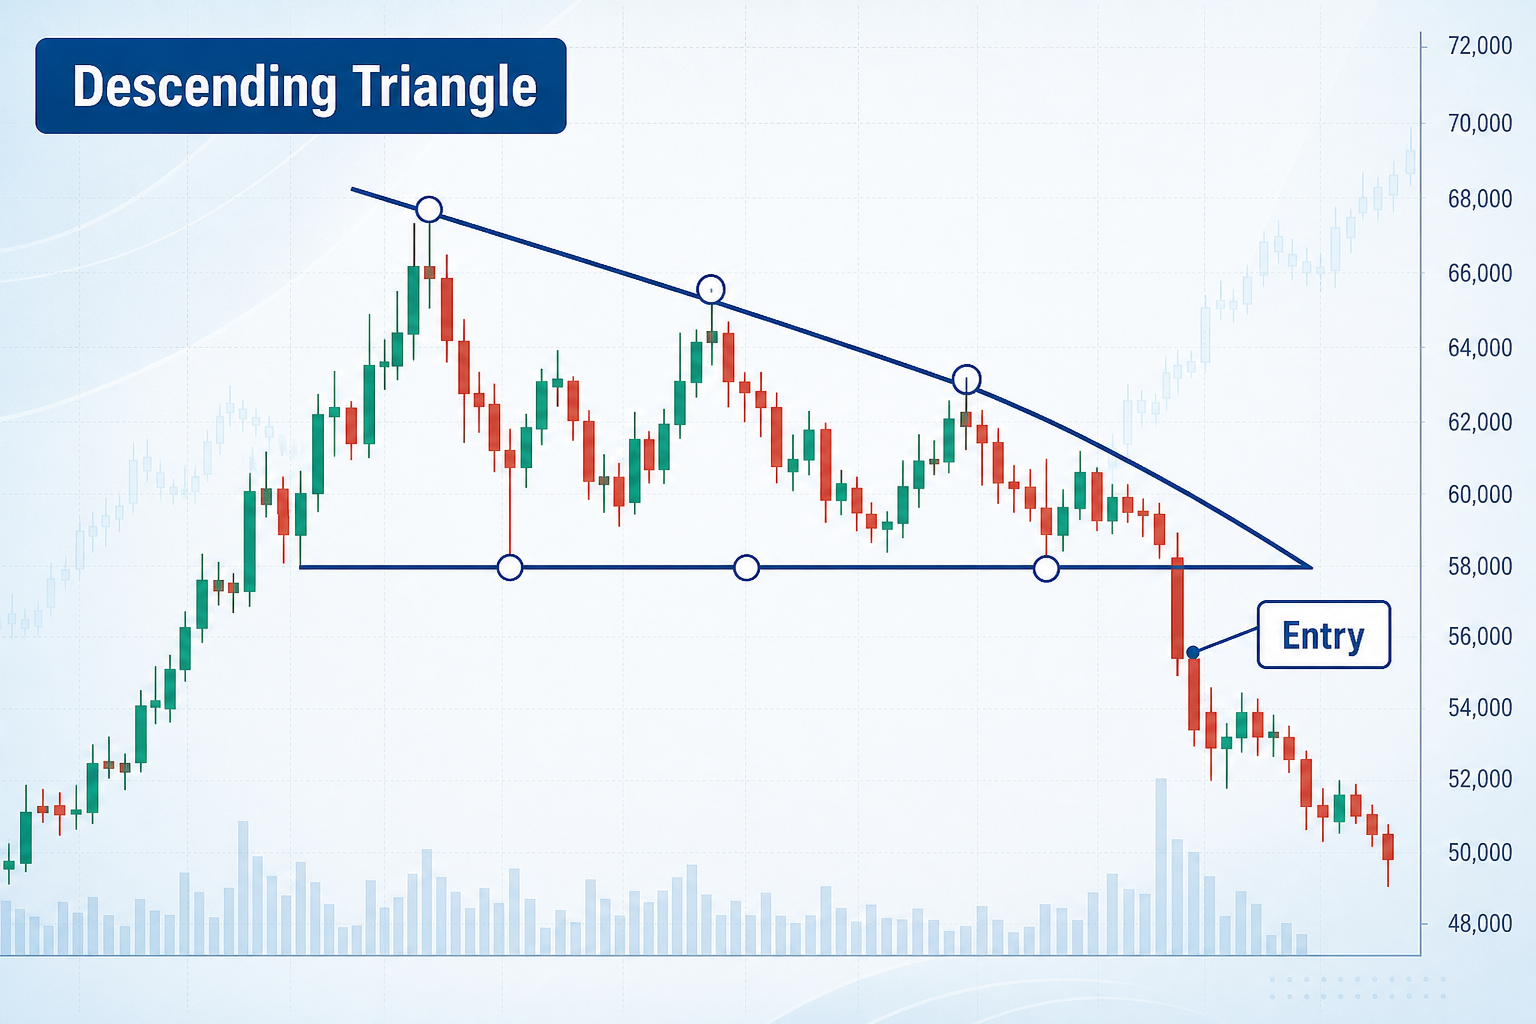
The Descending Triangle: Bearish Continuation
Descending triangles reflect selling pressure and usually form during downtrends. Price finds repeated support but prints lower highs each time, with sellers steadily dominating and compressing the move downward.
Structure
- Flat support line connects equal lows.
- Descending resistance line connects lower highs.
- Volume contracts during formation, then rises sharply on breakdown.
Trading the pattern
- Entry: place a sell order just below support.
- Stop-loss: set it above the descending resistance line.
- Take profit: measure the height and project it downward from the breakdown point.
Descending triangles typically break lower, but traders should still confirm signals before entering positions.
Symmetry and Pattern Confirmation
Triangle formations typically complete after five touches of the trendlines, either three on one side and two on the other or vice versa. Those touches validate the strength of support and resistance, and breakouts often occur near the triangle’s apex.
- Watch for a strong candle close beyond the trendline.
- Make sure volume rises during the breakout or breakdown.
- Use indicators like RSI or MACD to validate momentum.
Relying on confirmation helps traders avoid false breakouts, which often lead to losses.
Differences Between Ascending and Descending Triangles
Both are triangle patterns, but they reflect opposing market sentiments.
| Feature | Ascending triangle | Descending triangle |
| Market sentiment | Bullish | Bearish |
| Upper trendline | Flat (resistance) | Descending (resistance) |
| Lower trendline | Rising (support) | Flat (support) |
| Breakout direction | Typically upward | Typically downward |
| Volume behavior | Declines during pattern, then spikes | Declines during pattern, then spikes |
| Entry strategy | Buy above resistance | Sell below support |
These distinctions make it easier for traders to choose a strategy based on the pattern type. The same logic underlies other reversal setups too, like the head and shoulders pattern.
Chart Timeframes and Triangle Reliability
Triangle patterns show up across many timeframes, but longer intervals tend to give cleaner signals.
- Daily charts: best for spotting reliable triangle patterns.
- 4-hour charts: useful for confirming setups and refining entries.
- 1-hour charts: help fine-tune stop-loss and take-profit levels.
Traders should adapt their strategy to the timeframe they trade and to the volatility of the asset.
Practical Trading Tips
Traders aiming to use triangle patterns should follow a structured plan to raise their success rate.
- Wait for confirmed breakouts with volume spikes.
- Avoid trading inside the triangle unless you are scalping.
- Use stop-losses outside the pattern boundaries.
- Set profit targets based on the triangle’s height.
- Prepare for throwbacks or retests after a breakout.
Risk management is essential, because even well-formed patterns can fail due to unexpected news or market shocks.
Common Mistakes to Avoid
Even with a solid strategy, mistakes can reduce trading success:
- Entering before confirmation.
- Ignoring volume signals.
- Over-leveraging on breakout expectations.
- Failing to use stop-loss protection.
- Trading without checking the overall trend.
Discipline, patience, and a data-driven approach are what improve consistency over time.
Triangle Patterns in Technical Analysis
Triangle chart patterns are essential tools for traders analyzing price movement. They reveal market sentiment and likely breakout directions, and when applied correctly, ascending and descending triangles deliver clear, actionable trading setups.
 Stay Ahead in Crypto