
Key Takeaways
- The head and shoulders pattern signals a trend reversal: bearish at a top (three peaks), bullish at a bottom (inverse, three troughs).
- The neckline is the trigger. A close beyond it sets the entry; the head-to-neckline distance projects the price target.
- Reliability rises sharply when volume expands on the neckline break and a supporting indicator like RSI or MACD agrees with the direction.
In This Article
- Structure of the Standard Head and Shoulders
- Inverse Head and Shoulders Formation
- Trading Strategies Using the Pattern
- Advantages of the Pattern
- Disadvantages of the Pattern
- Volume and Technical Confirmation
- Timeframe Considerations
- Common Mistakes and Failed Patterns
- Trade Management Tips
- Trader Checklist
- Pattern Versatility Across Markets
Traders use the head and shoulders pattern to spot potential reversals in financial markets. It signals shifts from bullish to bearish trends or the other way around.
The pattern has three main points: a left shoulder, a head, and a right shoulder. A neckline connects the two troughs or peaks between them, and that neckline guides entries, stop-loss levels, and profit targets.
Structure of the Standard Head and Shoulders
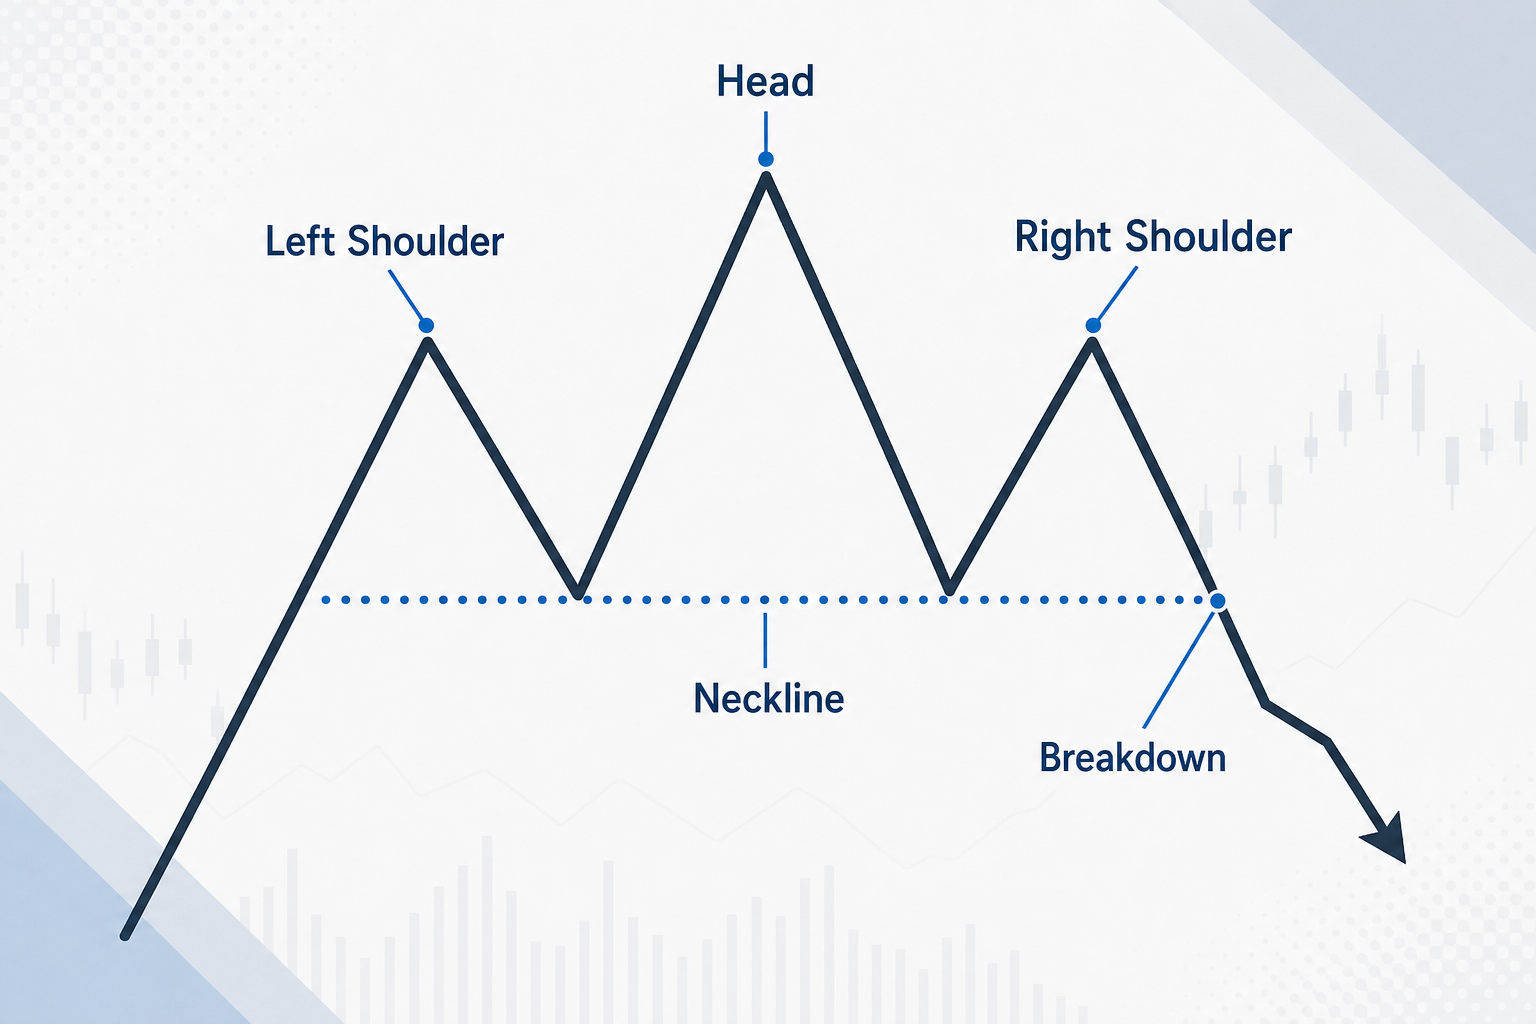
The left shoulder forms after an upward trend, where the price peaks and then declines slightly. This signals early market exhaustion.
The head forms as the price rises to a higher peak, representing the strongest part of the prior trend. The right shoulder forms as the price rises again but fails to reach the head, suggesting weakening buyers and a possible reversal.
Inverse Head and Shoulders Formation
The inverse pattern flips the structure and forms three troughs instead of peaks. Traders read it as a bullish reversal signal that follows a downtrend.
The left shoulder forms as a small low, followed by a deeper trough that becomes the head. The right shoulder then forms a higher low, which signals decreasing selling pressure.
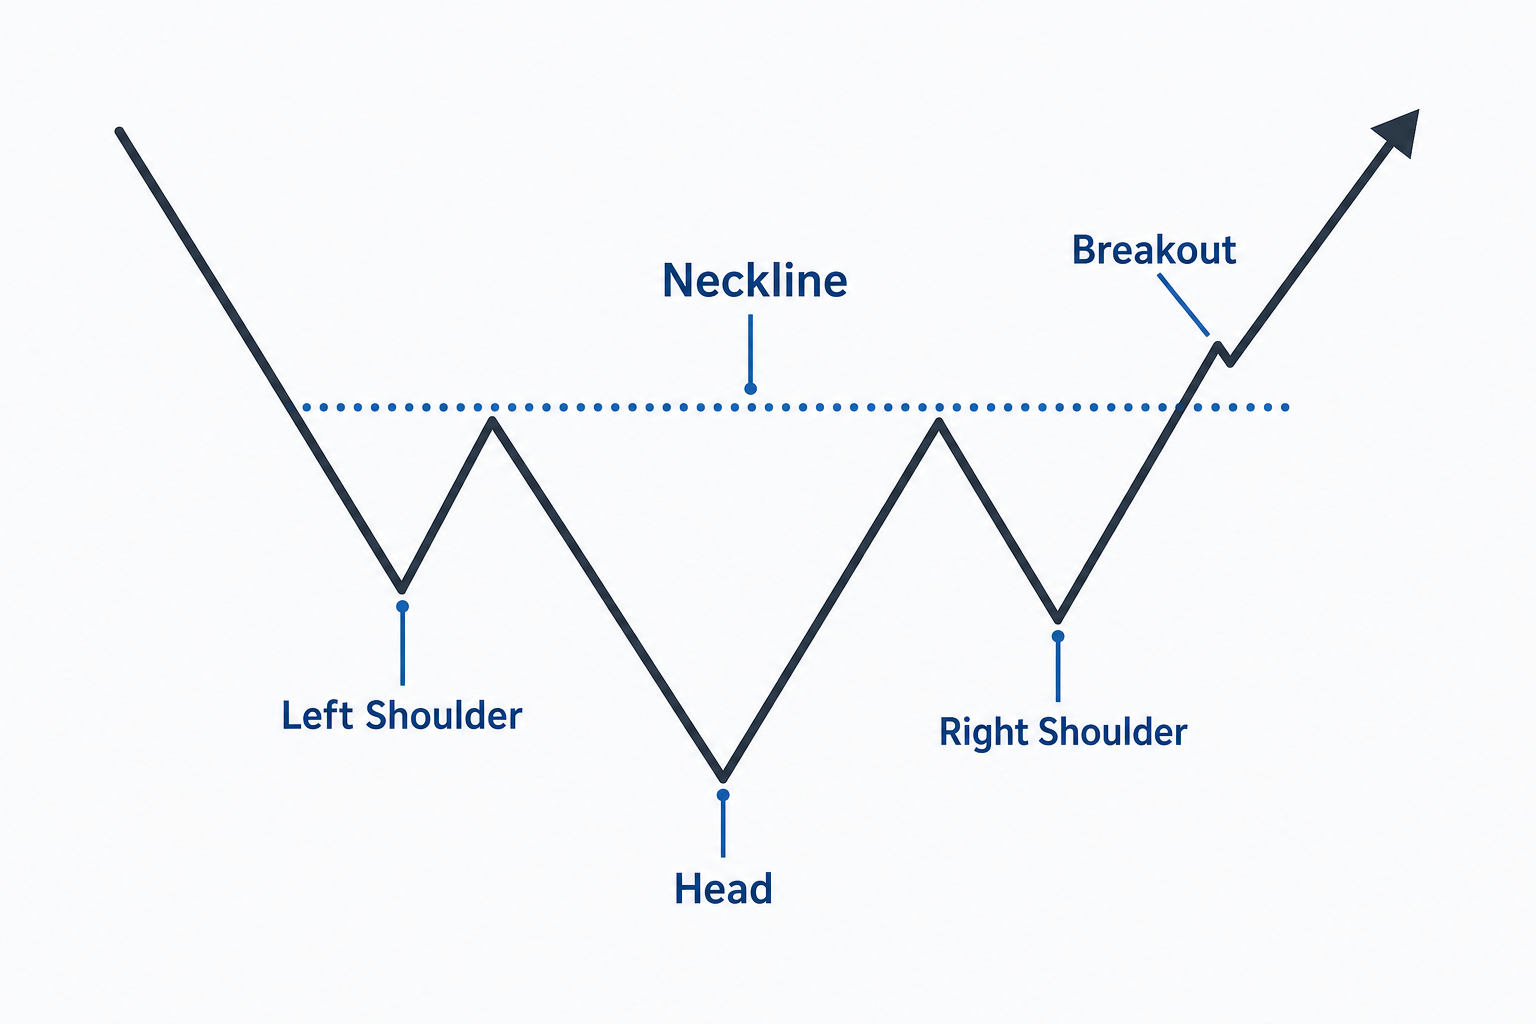
A breakout above the neckline confirms the reversal. The vertical distance from the head to the neckline sets the potential profit target.
Trading Strategies Using the Pattern
The neckline is the main trigger for trade confirmation. A break below the neckline in a standard pattern triggers short trades; a break above in an inverse pattern triggers long trades.
Stop-loss orders go just above the right shoulder in standard patterns and just below the right shoulder in inverse patterns. Entry options include:
- Breakout entry: trade immediately after the price closes beyond the neckline.
- Retest entry: wait for the price to retest the neckline for a better risk-to-reward ratio.
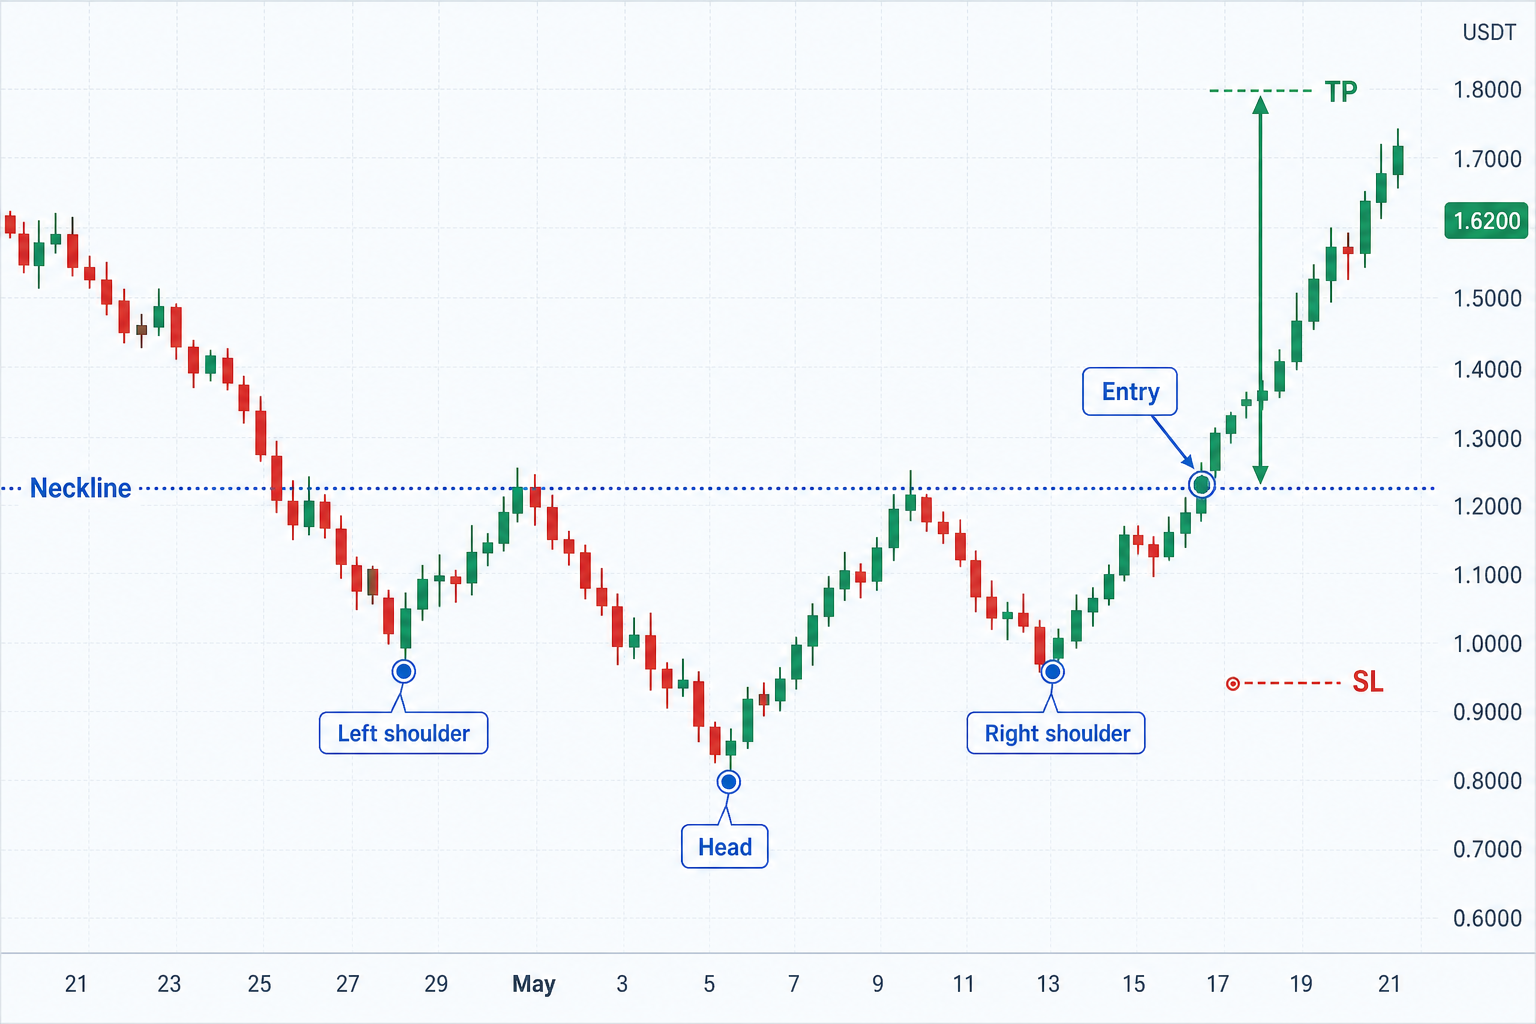
Profit targets are calculated using the head-to-neckline distance and projected from the breakout point. Multiple targets let traders secure partial profits if the price stops short of the full projected move.
Advantages of the Pattern
- Easy to identify once a trader has seen a handful of clean examples.
- Clear, mechanical entry, stop-loss, and profit levels.
- Works across stocks, forex, crypto, and commodities.
- Built-in projection method helps estimate the size of the move.
Disadvantages of the Pattern
- Novice traders often misidentify uneven shoulders or sloped necklines.
- Large stop-loss distances may be required in volatile markets.
- False breakouts happen and can trigger premature exits.
- Not every formation actually reverses; confirmation from other indicators is needed.
Volume and Technical Confirmation
Volume analysis improves the reliability of the pattern. High volume during a breakout raises the probability of a successful reversal.
Traders often combine the pattern with RSI, MACD, or moving averages. RSI can confirm overbought or oversold conditions, while moving averages show the trend’s underlying strength.
Timeframe Considerations
Patterns on higher timeframes, like the daily or four-hour chart, are more reliable. Shorter timeframes can produce false signals and need extra indicator confirmation.
Common Mistakes and Failed Patterns
- Entering trades before the neckline break reduces reliability.
- Ignoring stop-loss placement increases potential losses.
- Trading low timeframes tends to produce weak signals.
- Overestimating pattern reliability without volume or indicator confirmation can cause losses.
When a breakout fails, traders should re-check the pattern’s validity. Failed head and shoulders setups can still offer profitable counter-trades when watched carefully.
Trade Management Tips
- Monitor retests to confirm breakout strength.
- Place the stop-loss near the right shoulder and adjust if needed.
- Set multiple profit targets to lock in gains progressively.
- Combine the pattern with indicators for added confirmation of the reversal.
Trader Checklist
- Confirm the prior trend before declaring a pattern.
- Draw the neckline carefully, accounting for slope and placement.
- Use volume and indicators like RSI or MACD for confirmation.
- Measure the head-to-neckline distance to set the profit target.
- Wait for full pattern completion before entering trades.
- Stick to the stop-loss and the planned profit targets.
Pattern Versatility Across Markets
The head and shoulders structure works across equities, forex, crypto, and commodities. Traders can apply it consistently for risk-managed setups in any of those markets.
Pairing pattern recognition with technical indicators and disciplined risk management is what turns the head and shoulders into a repeatable tool rather than a one-off observation.
 Stay Ahead in Crypto