
Key Takeaways
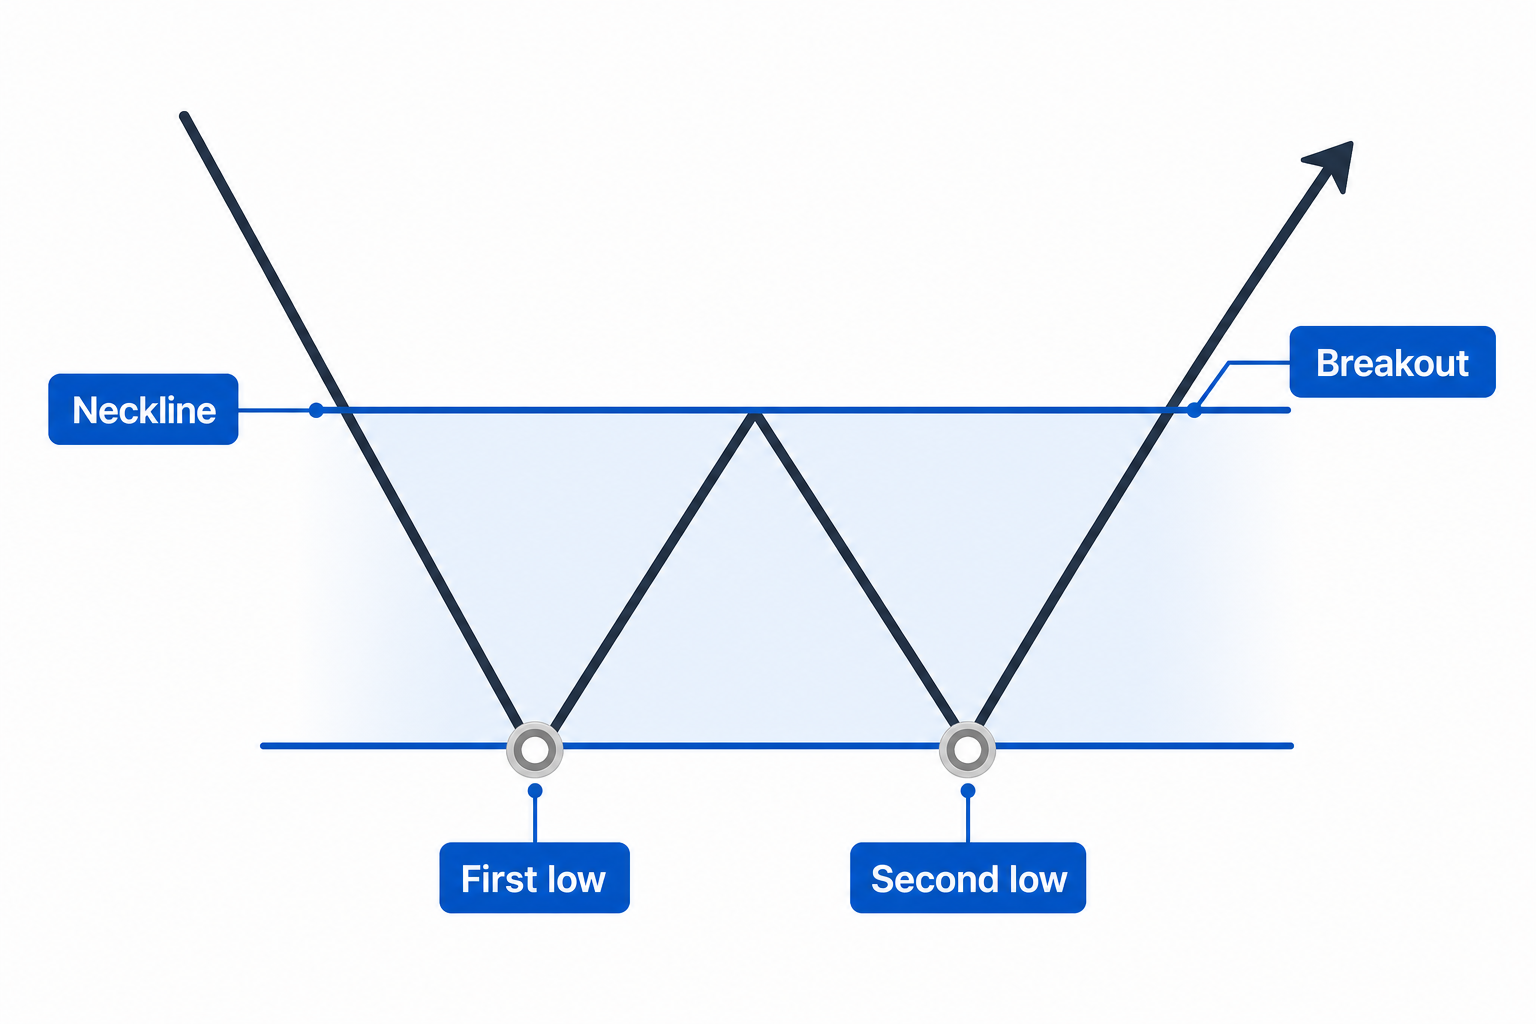
- A double bottom is a bullish reversal pattern shaped like a “W”: two roughly equal lows, a rebound to a middle peak (the neckline), and a second rebound that breaks above that neckline.
- The pattern is only confirmed when price closes above the neckline, ideally on rising volume; the move target equals the height from the lows to the neckline projected upward.
- It works best on daily and weekly charts, and pairs well with volume, RSI, and a moving-average crossover for additional confirmation.
In This Article
In financial markets, a double bottom is a classic bullish reversal pattern used in technical analysis. It signals a potential change in direction after a downtrend. The pattern forms when an asset’s price hits a low, rebounds, then drops again to a similar low before rising sharply. The shape it draws on a chart resembles the letter “W”.
Traders watch for this pattern because it suggests selling pressure may be weakening. When price fails to fall below the first low, it points to strong support. The pattern is confirmed when price breaks above the intermediate high between the two lows, called the neckline.
Structure of a Double Bottom
The double bottom is built in three phases. First, price moves lower and finds a strong support level, forming the first trough. Then it rebounds to create a temporary high or neckline. After that, it drops again to roughly the same level as the first trough and bounces a second time.
The second bounce is critical. If price rallies from this low and breaks above the neckline, the double bottom is considered complete. The confirmation of that breakout is the key buy signal for traders.

Key Features to Identify
A few conditions need to line up to call something a clean double bottom. The two lows should be close in value, ideally within 3% to 4% of each other, and the time between them should be long enough for the pattern to develop naturally, often days or weeks. A quick formation is more likely to be a false signal.
Volume matters too. Traders look for higher volume during the second rebound and especially during the breakout above the neckline. Rising volume on the breakout shows strong buying interest and adds weight to the signal.
How to Trade a Double Bottom
The double bottom gives traders a clear method for entering and managing trades. Most wait for price to close above the neckline before opening a position, which reduces the risk of acting on a false breakout.
A stop-loss order typically sits just below the second low to limit potential losses. The price target is calculated by measuring the distance from the lowest point of the pattern to the neckline, and adding that distance above the neckline. A worked example:
- First low = $90
- Neckline = $100
- Target = $110 (the $10 height projected above the neckline)
That math helps traders plan exits and estimate potential profit before entering.
Trading Strategies
Traders can approach the double bottom with different strategies, depending on their risk tolerance.
- Aggressive approach: enter at the second bottom before the breakout, aiming for an earlier entry but accepting more risk if the pattern fails.
- Conservative approach: wait for a confirmed breakout above the neckline. Safer entry, but the move is partly underway by then.
Either way, proper risk management is essential. Other reversal setups follow the same logic, like the head and shoulders pattern or ascending and descending triangles.
Double Bottom vs Double Top
The double bottom is the mirror image of a double top, which forms after an uptrend and signals a bearish reversal. While the double bottom suggests the asset has found strong support and is set to rise, the double top warns that resistance is strong and a decline may follow.
Traders use both patterns to identify market turning points and adjust positions accordingly.

Confirming the Pattern
Traders often layer in technical tools to confirm a double bottom. Moving averages can flag a new uptrend when a shorter-term moving average crosses above a longer-term one. That cross, known as a “golden cross”, supports the bullish signal.
Momentum indicators like RSI add another layer of confidence. An RSI reading rising above 50 during the breakout signals growing buying momentum. Volume confirmation remains the single most important factor, especially right at the breakout candle.
Important Considerations
The double bottom is widely used, but it isn’t foolproof. Traders need to be wary of false breakouts, especially in volatile markets. A breakout that fails to hold above the neckline can produce losses fast if stop-loss levels aren’t in place.
The pattern is most effective on longer timeframes like daily or weekly charts. Shorter timeframes can show similar shapes that lack reliability.
Bullish Trend Reversal
The double bottom is one of the most respected chart patterns in technical analysis. It forms after a sustained downtrend and shows the asset has reached a strong support level. When price rebounds twice from this level and breaks above the neckline, it points to a potential trend reversal to the upside.
Traders who learn to identify, confirm, and trade the double bottom can use it to enter positions with a favorable risk-reward ratio. The pattern isn’t a guarantee, but it works best when combined with volume analysis and supporting indicators, and applied with consistent risk management.
 Stay Ahead in Crypto