Solana (SOL) is currently trading at $90.14, continuing its tight consolidation phase as market participants look for a definitive breakout direction following the steep winter correction.
In our previous analysis, we monitored the vital support structure holding the asset up. Since then, the price has successfully defended the lower support zones, forming a sideways base as it battles local moving averages.
. . .
Technical Breakdown
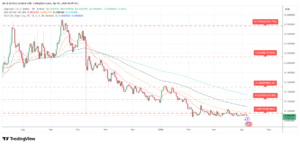
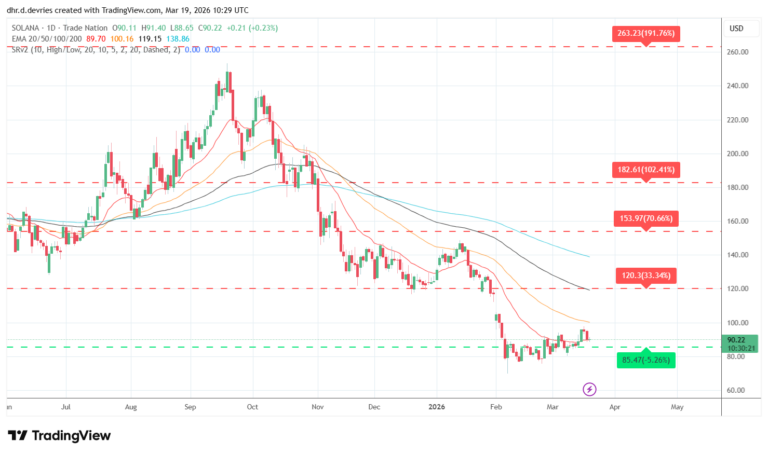
The daily chart illustrates a prolonged macro downtrend that is currently pausing, with the price attempting to build momentum from the recent local lows.
- EMA 20 (Red): Sitting at $89.70, the price is currently hovering just above this short-term momentum indicator. Establishing this line as firm support is the critical first step toward a bounce.
- EMA 50 & 100 (Yellow/Black): Positioned at $100.16 and $119.14 respectively, these lines act as significant medium-term resistance barriers. The downward slope of both confirms the overarching bearish market structure.
- EMA 200 (Blue): Located at $138.86, this long-term trend indicator remains far above current price action, underscoring that the macro environment is still heavily controlled by bears.
. . .
The Bullish Path
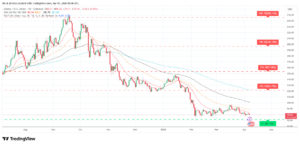
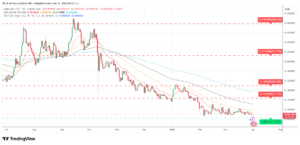
For a meaningful bullish reversal, Solana must first push through the 50-day EMA near the $100 psychological level. From there, buyers must break and close above the primary red resistance box at $120.30 to trigger a structural shift and target the next major resistance at $153.97.
. . .
The Bearish Path
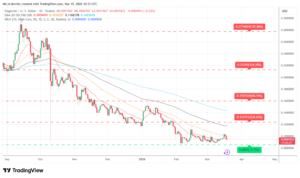
The immediate green support box at $85.47 is the ultimate line in the sand for bulls. If the broader market weakness persists and SOL loses this support floor, it risks further downside capitulation into uncharted lower territory.
. . .
Weekly Verdict
Solana is showing early signs of stabilization at key support, but the asset remains vulnerable to downside risk until it can decisively overcome the $100 to $120 resistance cluster.
 Stay Ahead in Crypto