
Major blockchain networks are facing renewed scrutiny as decentralization metrics expose growing control by a few key players. The Nakamoto Coefficient, a leading measure of blockchain decentralization, has become a critical indicator of a network’s resistance to disruption.
Originally proposed by Balaji Srinivasan and Leland Lee, the Nakamoto Coefficient identifies the minimum number of entities required to compromise a blockchain’s consensus. A higher coefficient signals stronger decentralization, while a lower one indicates potential vulnerabilities arising from power concentration.
Proof-of-Stake (PoS) and Proof-of-Work (PoW) blockchains both apply the metric based on their consensus models. In PoW networks like Bitcoin, the focus is on hashrate concentration. In PoS networks such as Ethereum, the emphasis is on the stake held by validators.
Recent data from Chainspect highlights sharp differences across major networks. As of November 2025, Polkadot continues to show one of the highest reported Nakamoto Coefficients in the industry, reflecting a broad spread of network control. In contrast, Ethereum and Polygon display significantly lower coefficients, which continues to raise concerns about staking concentration and validator dominance.
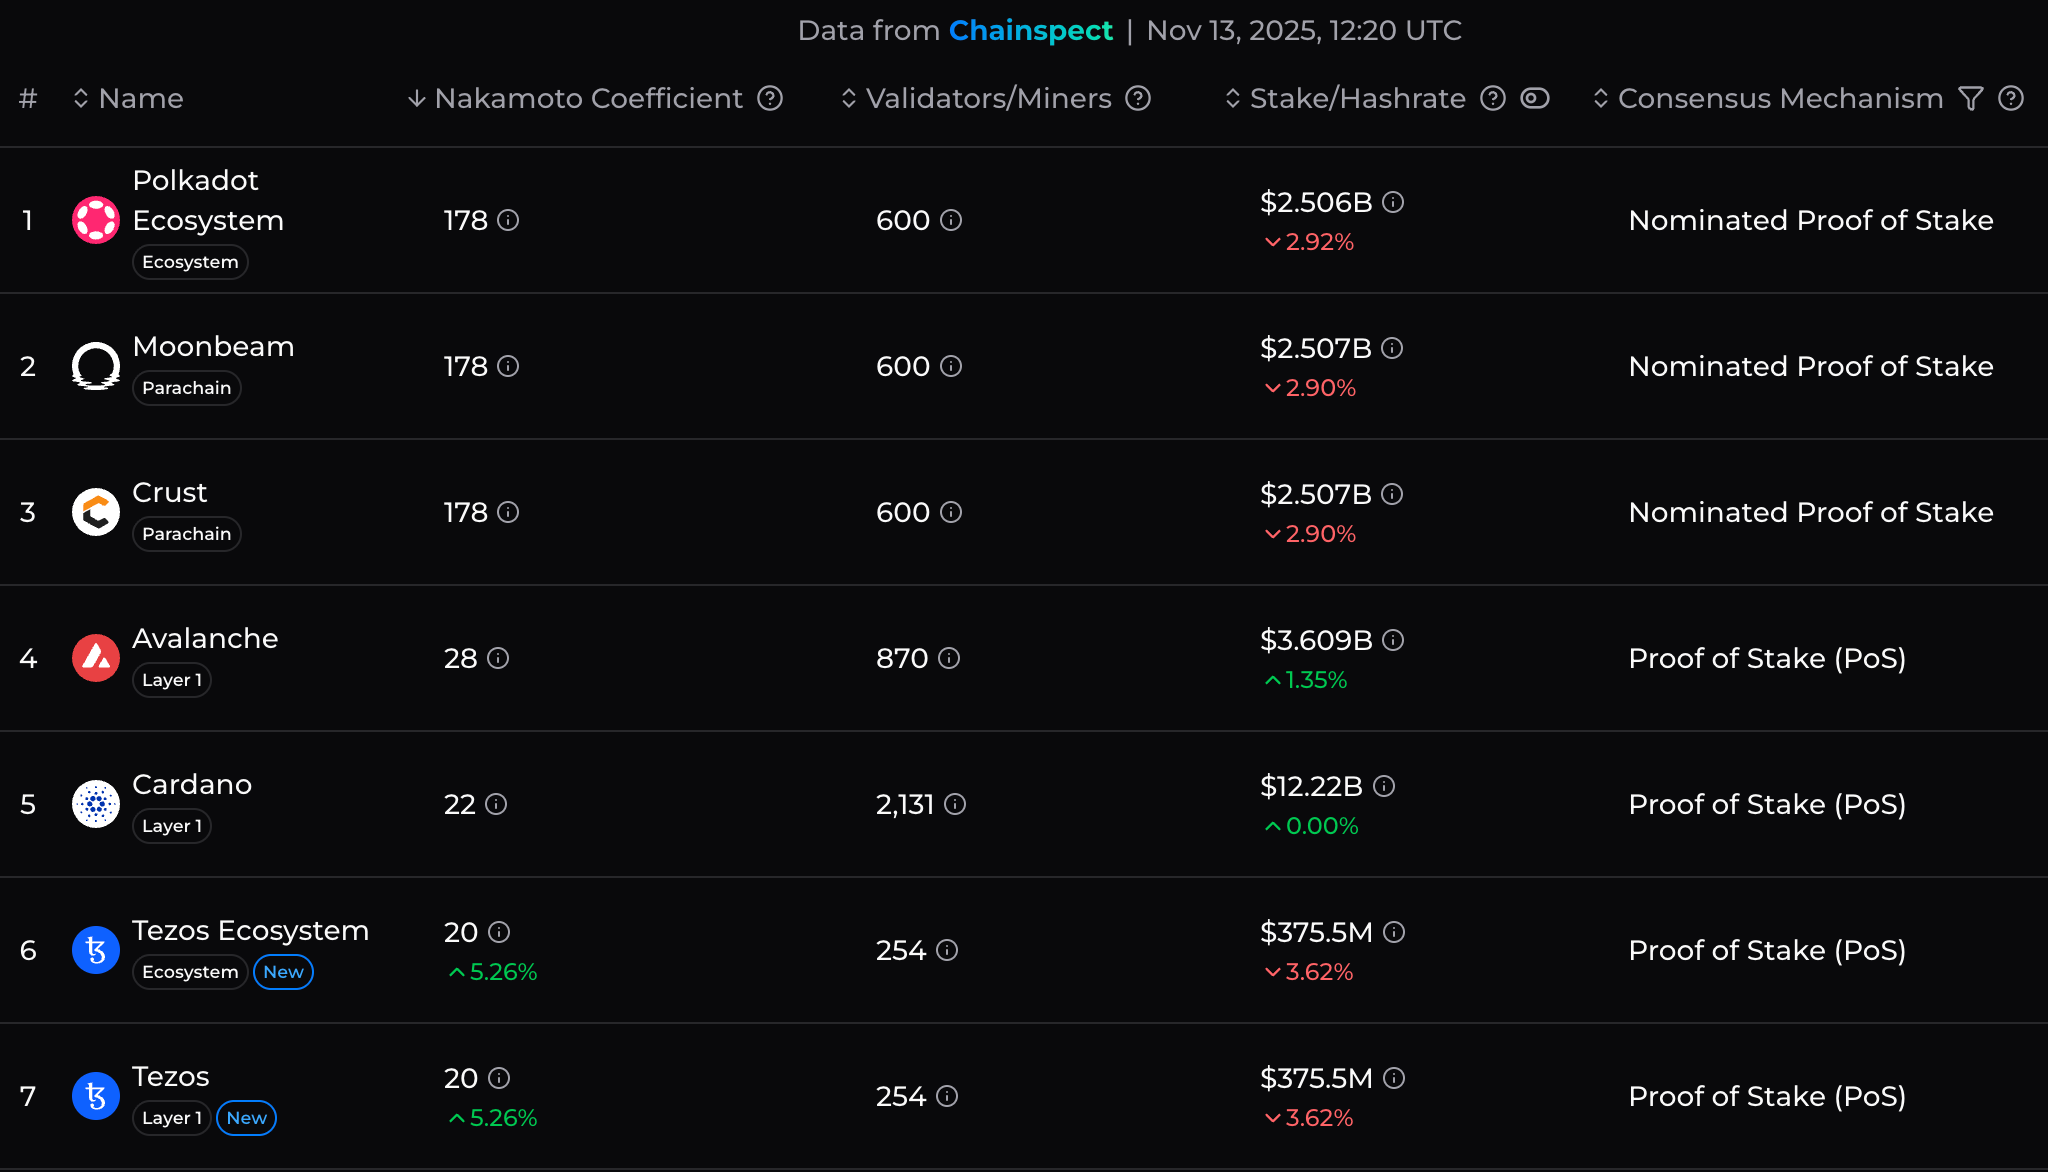
Check the most up-to-date numbers at Chainspect.
These numbers reflect how many independent validators must collude to halt consensus. A low figure suggests that just a few parties could potentially control block production or censor transactions.
Bitcoin, often seen as the most decentralized blockchain, shows mixed results. While it has over 9,000 active nodes, its Nakamoto Coefficient based on mining pools currently stands at 3. Foundry USA, AntPool, and ViaBTC together control more than 63% of the hashrate, exposing it to theoretical 51% attacks.
The metric doesn’t stop at mining or staking. In advanced applications, it also evaluates:
- Client software diversity
- Token ownership concentration
- Developer control
- Node distribution
- Exchange dominance
These additional layers highlight that decentralization is multi-dimensional. A blockchain might appear resilient in validator distribution, but still rely on a single client or developer group.
Ethereum, for example, has a large number of validators but remains heavily reliant on entities like Lido and Coinbase, which together hold a sizable portion of staked ETH. This reduces its Nakamoto Coefficient despite the network’s scale.
The coefficient has become a key decision-making tool across the industry. Developers use it to adjust governance mechanisms. Investors use it to assess risk. Validators use it to choose delegation strategies. Projects use it as a benchmark for network health.
Key Functions of the Nakamoto Coefficient:
- Measures the minimum control threshold needed to halt or disrupt a network.
- Flags centralization risks in staking, mining, or governance.
- Assists stakeholders in making informed decisions.
- Serves as a warning system when power is overly concentrated.
A growing number of PoS networks have started reporting the coefficient as part of their transparency efforts. Community-run dashboards and tools like Nakaflow calculate these values using real-time validator data. Metrics are updated every six hours and provide ongoing insight into how power shifts within a blockchain.
Protocols are also beginning to implement features that incentivize higher Nakamoto Coefficients. Some chains promote stake rebalancing, delegator education, and validator set rotation. Others limit how much stake a single operator can control.
Yet the metric has known limitations. It captures a single moment in time, not the dynamics that constantly change validator distribution or mining dominance. It can also misrepresent decentralization if validators run multiple nodes under different identities.
Challenges in defining what qualifies as an “entity” persist. A mining pool may comprise thousands of individuals, while a validator cluster could be controlled by one organization. These nuances require ongoing refinement in calculation methods.
Researchers have also proposed enhancements to the model. The Internet Computer project, for example, uses a weighted logarithmic average across decentralization subsystems instead of relying solely on the lowest score. This captures meaningful shifts, such as when a network improves from 1 to 2 critical entities, which can have more impact than moving from 10 to 11.
Main Limitations of the Nakamoto Coefficient:
- Static snapshot; doesn’t reflect network dynamics over time.
- Difficulty in accurately identifying entity control.
- Doesn’t account for infrastructure centralization or off-chain power.
- Cannot measure intent or likelihood of collusion.
- Thresholds may vary between blockchains.
Nonetheless, the coefficient remains one of the most widely recognized tools to quantify decentralization. As more institutional players enter blockchain ecosystems, its relevance continues to grow.
Several community initiatives are encouraging token holders to support decentralization actively. Chainflow and similar operators advocate staking with smaller validators and avoiding dominant pools. Educational campaigns now promote decentralization not just as a principle but as a shared responsibility.
Ways Token Holders Can Support Higher Nakamoto Coefficients:
- Stake with smaller or independent validators.
- Avoid centralized exchanges for delegation.
- Use algorithmic stake splitters for auto-distribution.
- Participate in governance to support decentralization proposals.
- Monitor real-time data from platforms like Nakaflow.
Market leaders are watching closely. As regulatory scrutiny increases and decentralization becomes a compliance factor, blockchain networks may be required to demonstrate their Nakamoto Coefficients publicly. This could soon become part of due diligence for institutional adoption.
In emerging networks, coefficient tracking is already informing network upgrades. Some protocols have adjusted validator caps, while others have diversified node geography or improved client diversity. These changes aim to prevent control from concentrating among early adopters or capital-heavy entities.
Technologies like sharding, rollups, and liquid staking derivatives are also reshaping decentralization patterns. While they may increase scalability, they can either improve or reduce Nakamoto Coefficients depending on how power is distributed across layers.
Stakeholders continue to debate the best methods to balance performance with decentralization. But with rising awareness and better tools, the Nakamoto Coefficient remains at the center of how the industry measures control.
As blockchain adoption accelerates, maintaining healthy decentralization metrics will be vital for securing user trust, system reliability, and resistance to attack.
