Traders use the head and shoulders pattern to identify potential reversals in financial markets. It signals changes from bullish to bearish trends or vice versa.
The pattern consists of three main points: a left shoulder, a head, and a right shoulder. A neckline connects the two troughs or peaks, guiding trade entries, stop-loss levels, and profit targets.
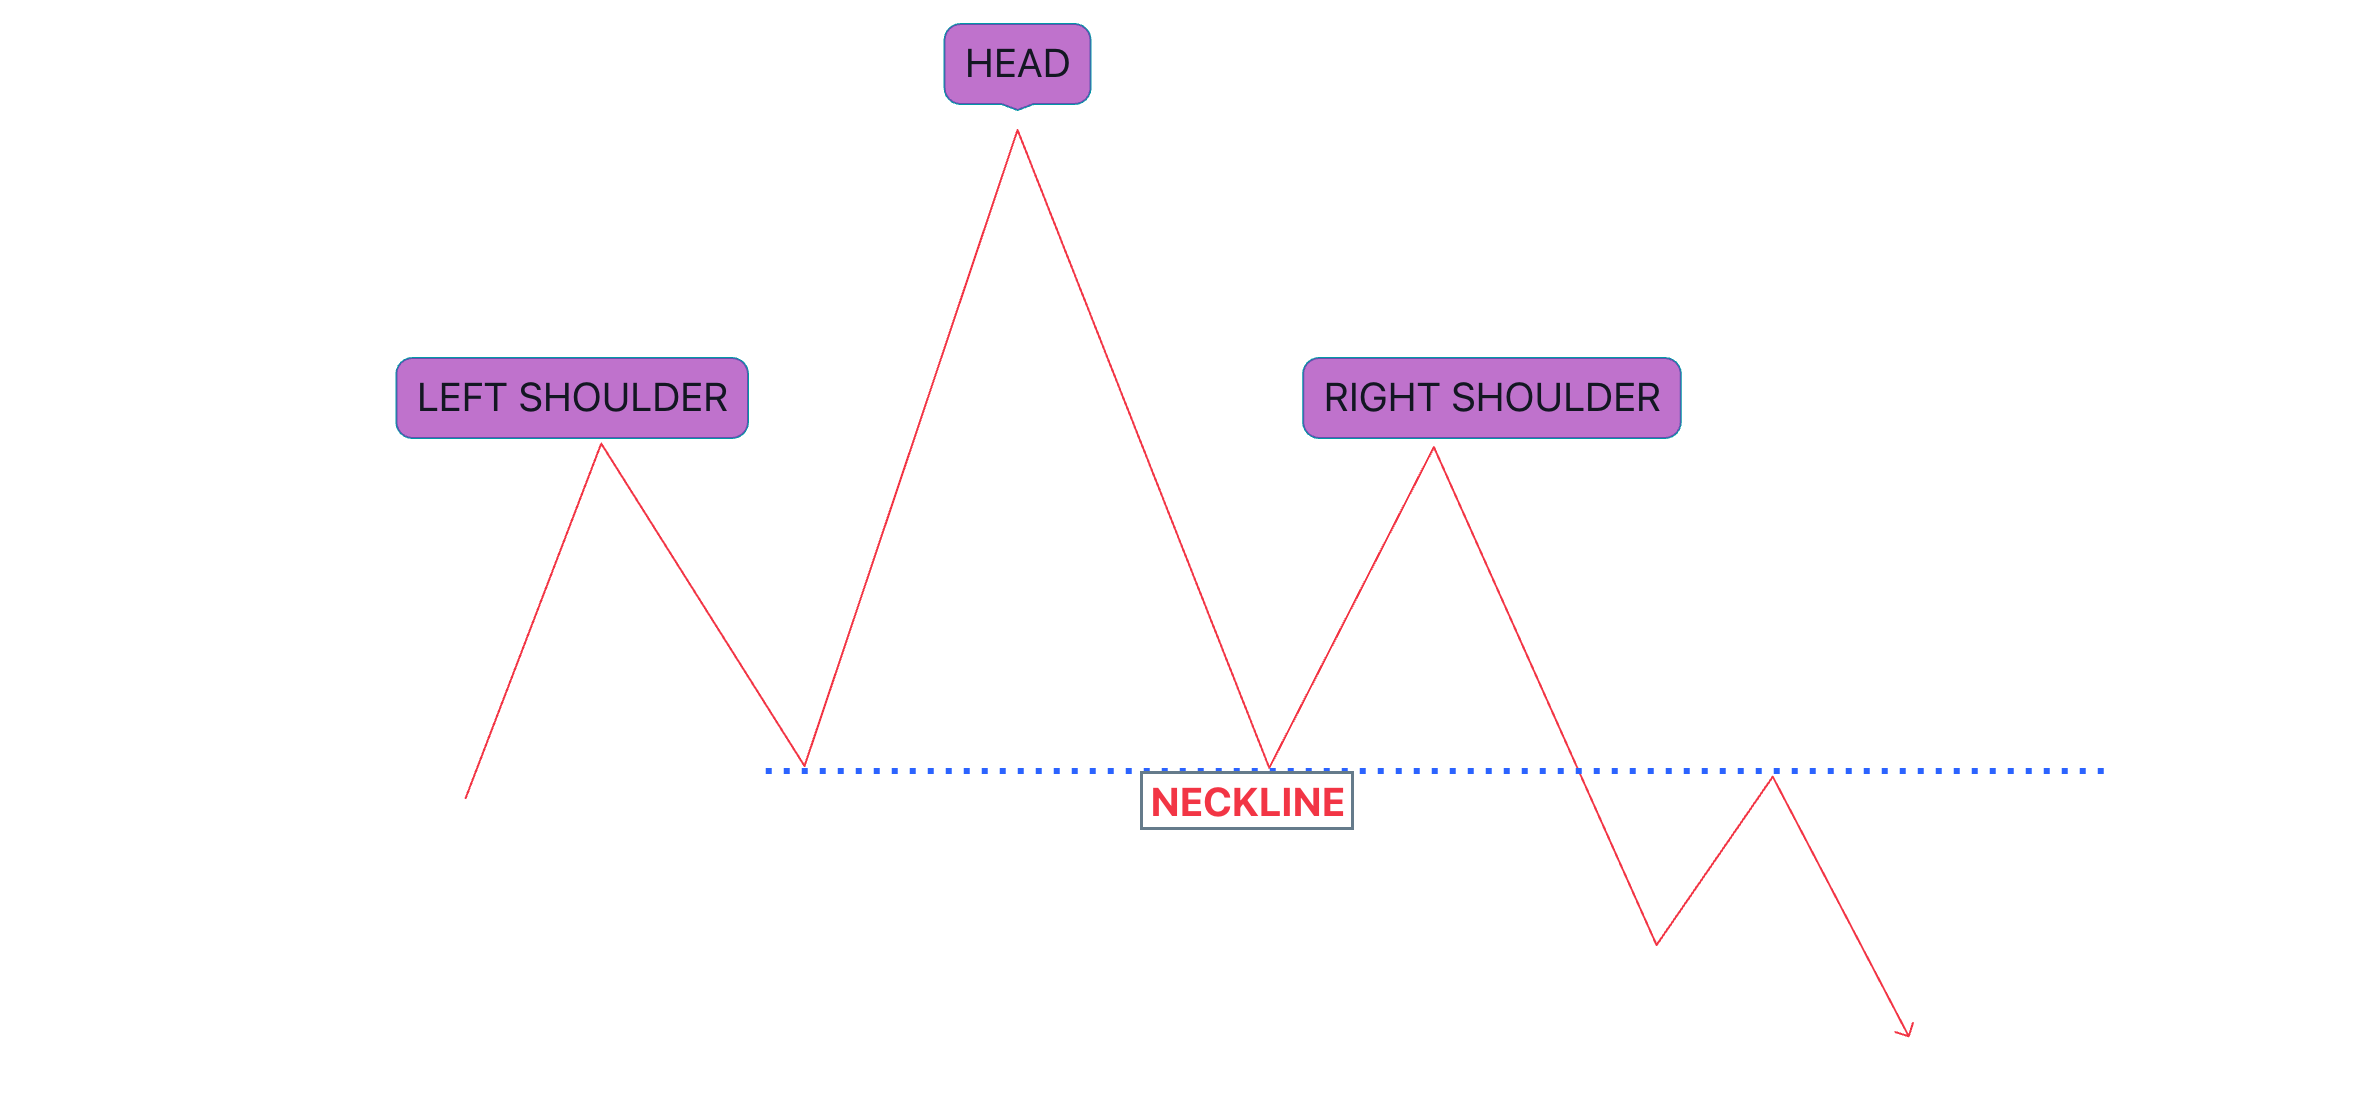
Structure of the Standard Head and Shoulders
The left shoulder forms after an upward trend, where the price peaks and declines slightly. This signals early market exhaustion.
The head forms as the price rises to a higher peak, representing the strongest part of the prior trend. The right shoulder forms as the price rises again but fails to reach the head, suggesting weakening buyers and a possible reversal.
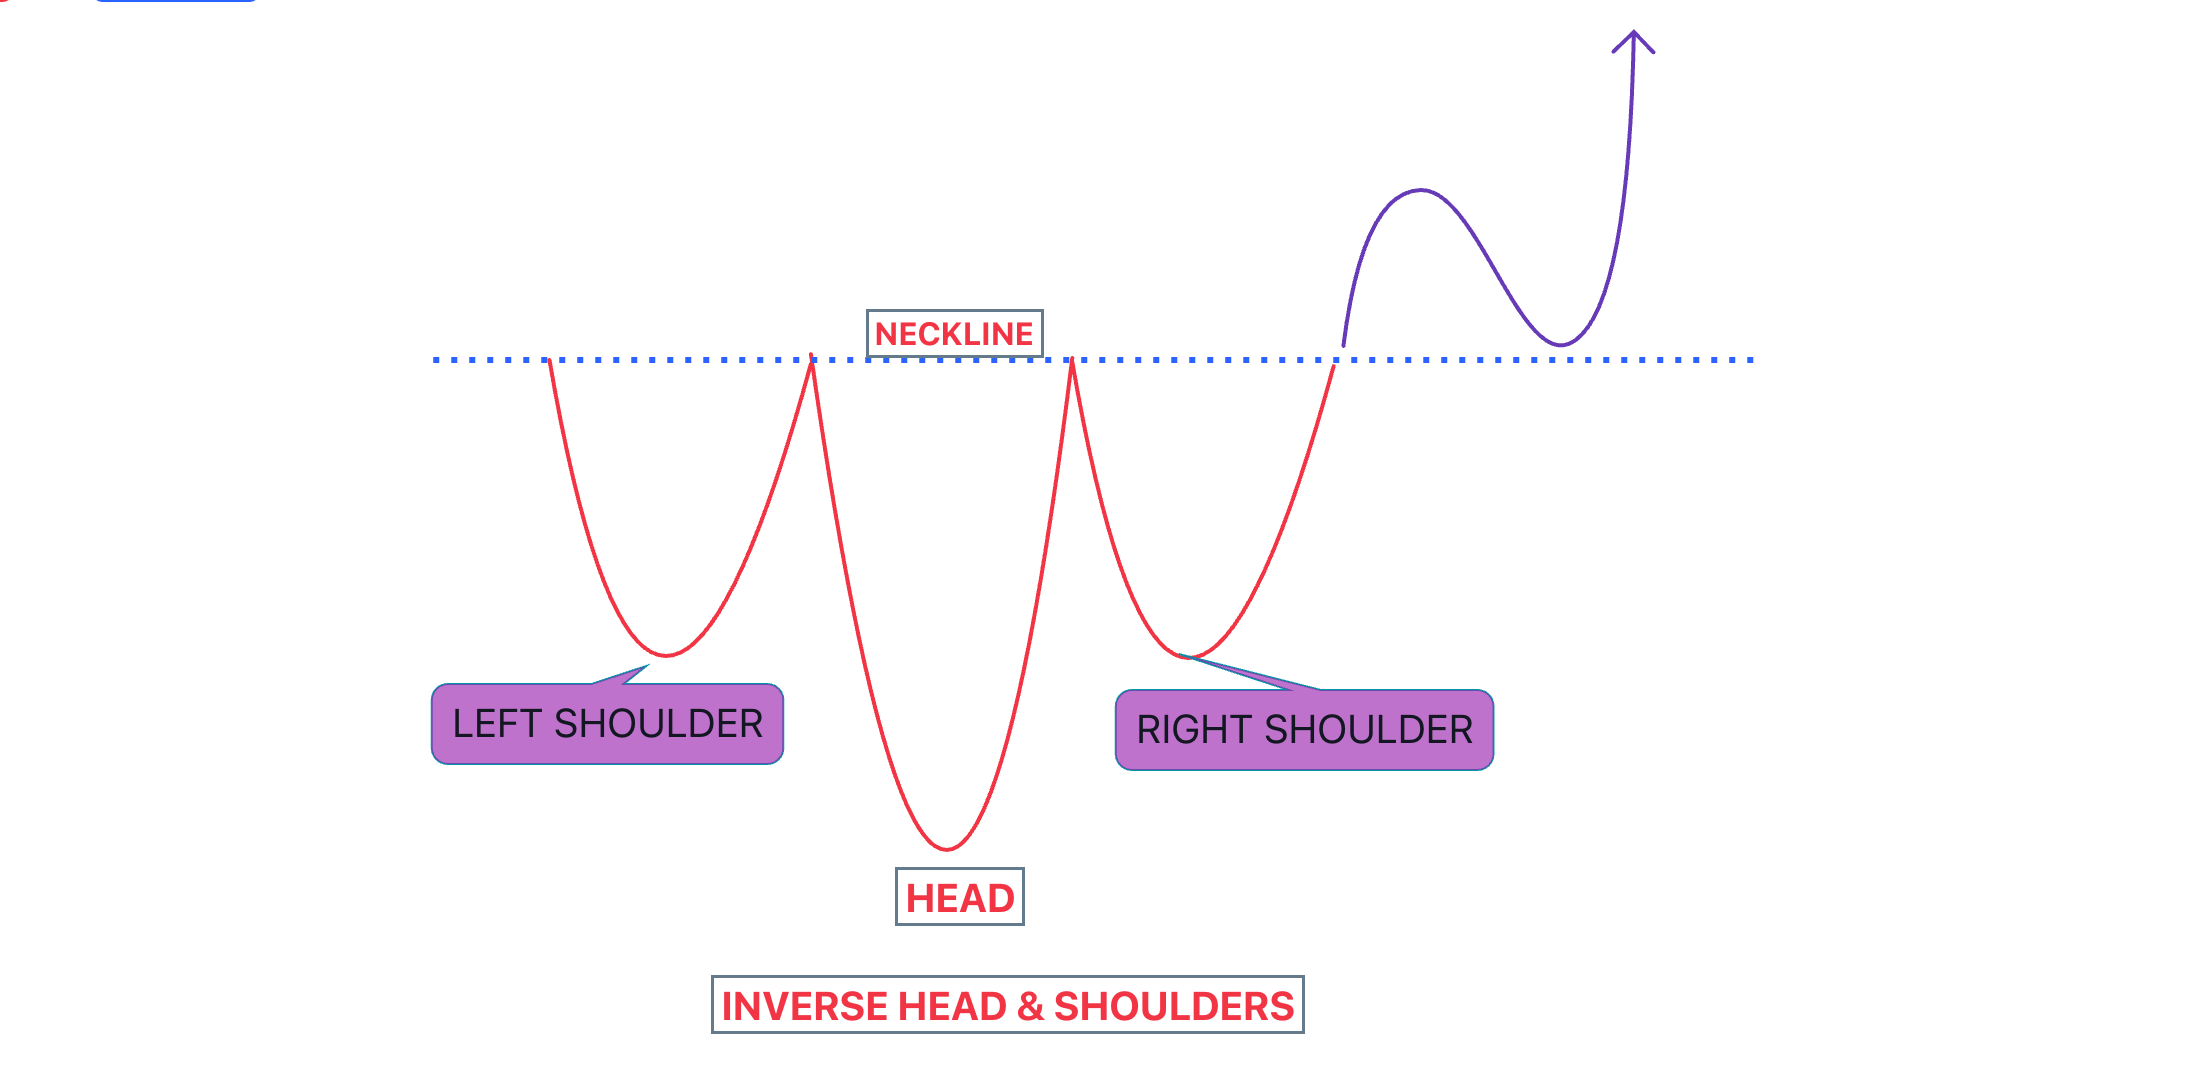
Inverse Head and Shoulders Formation
The inverse pattern flips the structure, forming three troughs instead of peaks. Traders interpret this as a signal for a bullish reversal following a downtrend.
The left shoulder forms as a small low, followed by a deeper trough forming the head. The right shoulder then forms a higher low, indicating decreasing selling pressure.
A breakout above the neckline confirms the reversal. The vertical distance from the head to the neckline sets potential profit targets.
Trading Strategies Using the Pattern
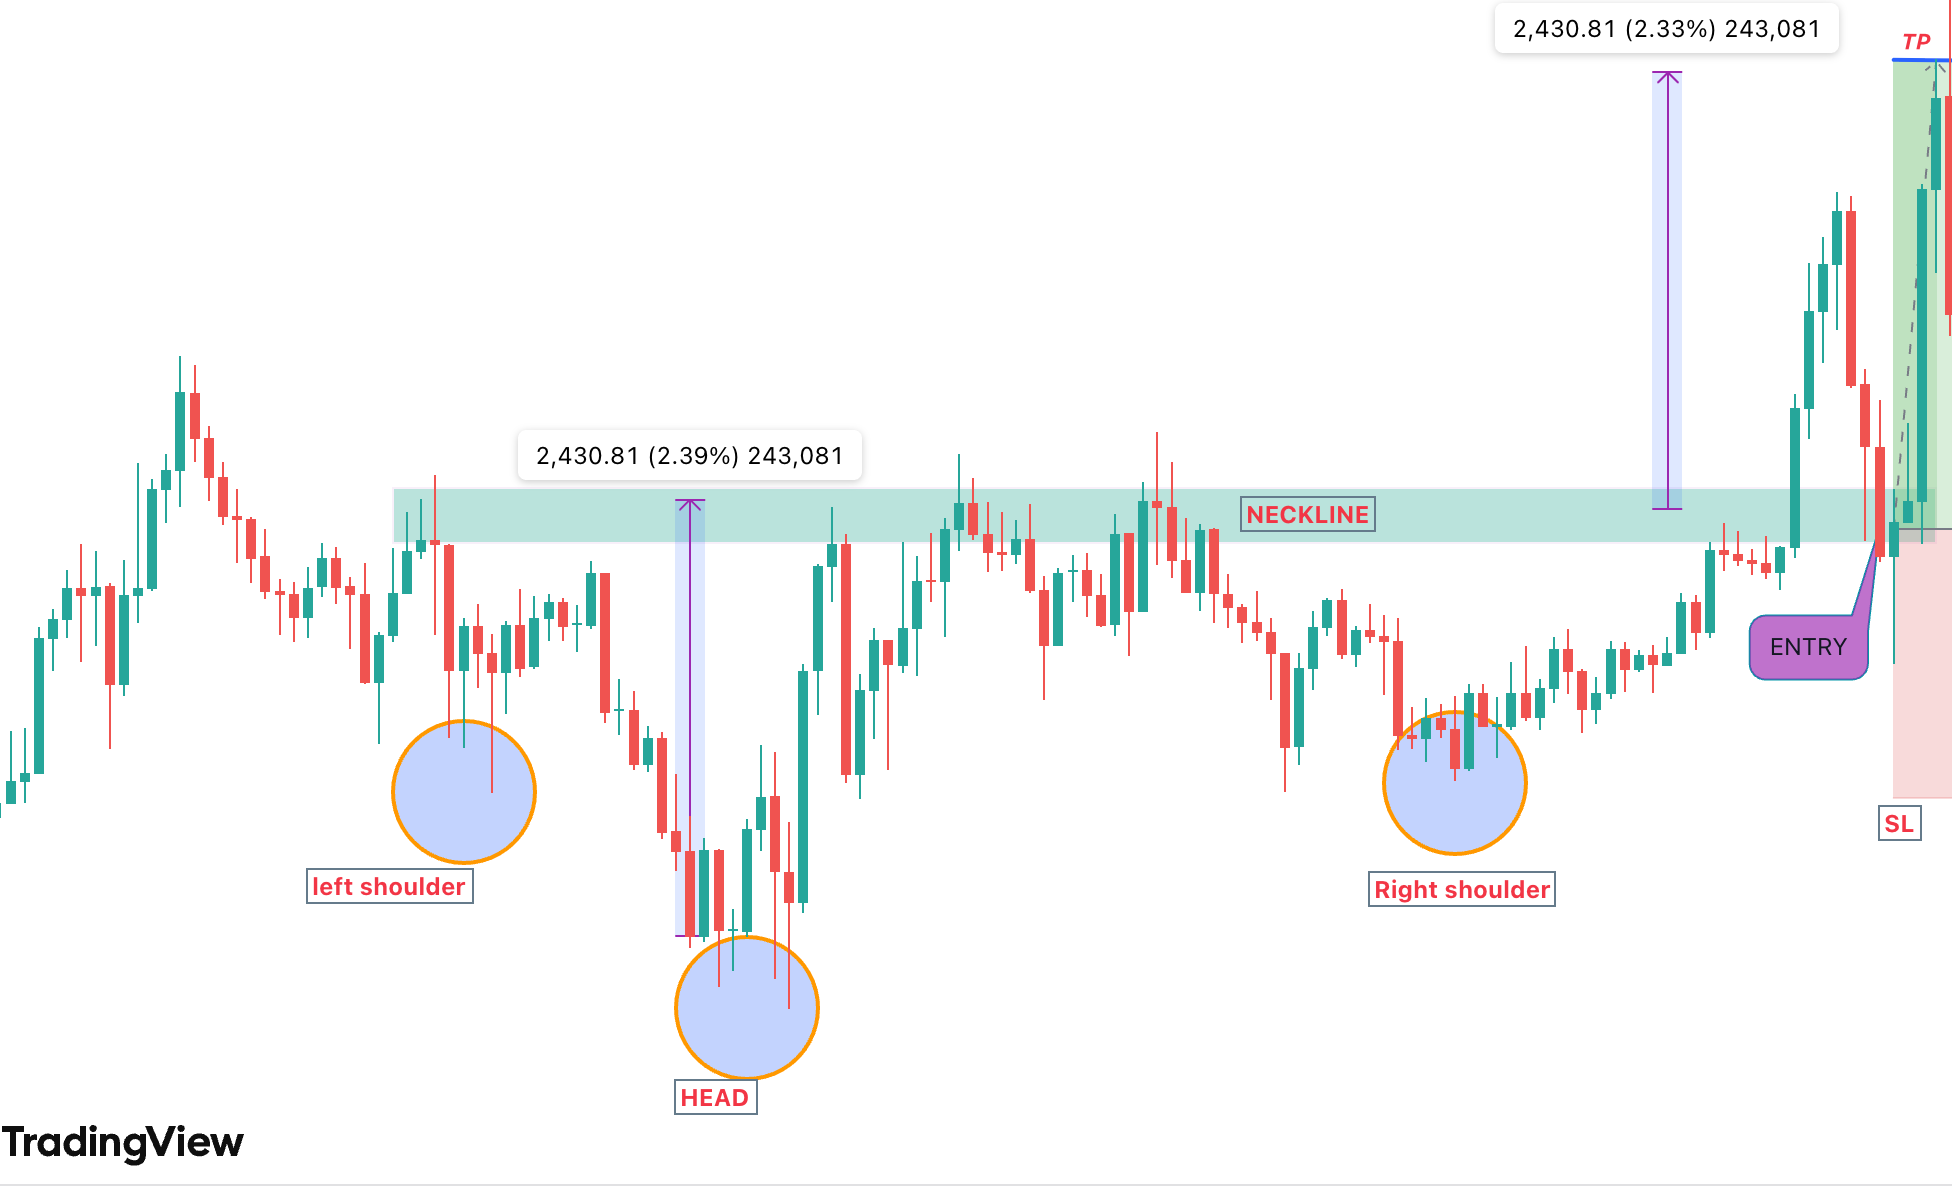
The neckline serves as the main trigger for trade confirmation. A break below the neckline in a standard pattern triggers short trades, while a break above in an inverse pattern triggers long trades.
Stop-loss orders are placed just above the right shoulder in standard patterns and just below the right shoulder in inverse patterns. Entry options include:
- Breakout Entry: Trade immediately after the price closes beyond the neckline.
- Retest Entry: Wait for the price to retest the neckline for a better risk-to-reward ratio.
Profit targets are calculated using the head-to-neckline distance, projected from the breakout point. Multiple targets allow securing partial profits if the price does not reach the full projected movement.
Advantages of Head and Shoulders Patterns
- Easy to identify for experienced traders.
- Clear entry, stop-loss, and profit levels.
- Works across stocks, forex, crypto, and commodities.
- Helps estimate potential market movement.
Disadvantages
- Novice traders may misidentify uneven shoulders or sloped necklines.
- Large stop-loss distances may be required in volatile markets.
- False breakouts can occur, triggering premature exits.
- Not all formations guarantee trend reversals; confirmation is needed from other indicators
Volume and Technical Confirmation
Volume analysis improves the reliability of the pattern. High volume during a breakout increases the probability of a successful reversal.
Traders often combine the pattern with RSI, MACD, or moving averages. RSI can confirm overbought or oversold conditions, while moving averages indicate trend strength.
Timeframe Considerations
Patterns on higher timeframes, like daily or four-hour charts, are more reliable. Shorter timeframes may produce false signals and require additional indicator confirmation.
Common Mistakes and Failed Patterns
- Entering trades before the neckline break reduces reliability.
- Ignoring stop-loss placement increases potential losses.
- Trading low timeframes can produce weak signals.
- Overestimating pattern reliability without volume or indicator confirmation can cause losses.
When the breakout fails, traders should verify the pattern’s validity. Failed head and shoulders patterns can still offer profitable setups if monitored correctly.
Trade Management Tips
- Monitor retests to confirm breakout strength.
- Place stop-loss near the right shoulder and adjust if needed.
- Set multiple profit targets to lock in gains.
- Combine with indicators for added confirmation of reversal.
Key Takeaways for Traders
- Confirm prior trend before pattern recognition.
- Draw neckline accurately, considering slope and placement.
- Use volume and technical indicators like RSI or MACD for confirmation.
- Measure head-to-neckline distance to set profit targets.
- Wait for full pattern completion before entering trades.
- Maintain discipline with stop-losses and multiple targets.
Pattern Versatility Across Markets
The head and shoulders structure works across equities, forex, crypto, and commodities. Traders can use it consistently for risk-managed setups across markets.
By combining pattern recognition with technical indicators and proper risk management, traders can improve reliability and capture market reversals effectively.
