
What Is a Bubble?
How market bubbles form and burst, from the 17th-century Tulip Mania to the 2022 LUNA and FTX collapse, and the warning signs to watch for.
How market bubbles form and burst, from the 17th-century Tulip Mania to the 2022 LUNA and FTX collapse, and the warning signs to watch for.
How the RSI oscillator scores momentum on a 0-100 scale, flags overbought and oversold zones, and helps traders spot reversals.

A short squeeze happens when rising prices force short sellers to buy back, fueling more buying. In crypto, leverage makes these moves explosive.

FOMO drives impulsive crypto trades that often end in losses. Learn the triggers, real-world examples and how to keep emotion out of your investing.
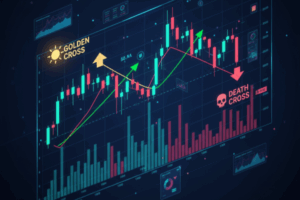
The Golden Cross and Death Cross are moving-average crossovers that flag bullish or bearish trend shifts, most reliable on daily charts with volume.
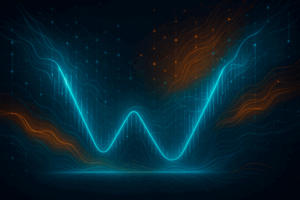
A double bottom is a bullish reversal pattern with two equal lows and a neckline breakout, signaling strong support and potential upside.

Ascending and descending triangles signal breakouts during consolidation, showing shifting buyer and seller pressure for bullish or bearish entries.
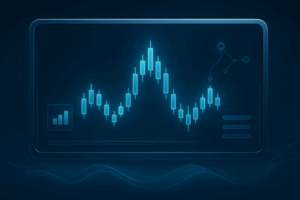
The head and shoulders pattern signals trend reversals through three peaks (or troughs), with the neckline guiding entries, stops, and profit targets.

Perpetual futures are popular because they allow traders to follow market moves without holding the asset itself, and on the surface the structure looks simple....
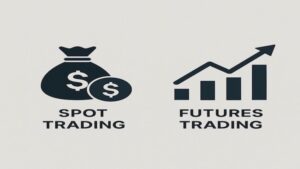
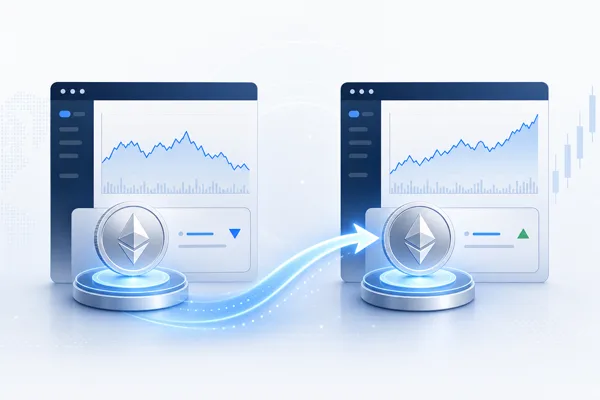
Most traders walk into the market without really knowing how spot vs. futures trading differs, and it feels pretty normal at first. Both setups look...