Table of Contents
What is MACD?
MACD stands for Moving Average Convergence/Divergence and is an indicator traders use to see what the trend is in a price. The MACD indicator is a popular technical indicator used for different securities. (stocks, cryptocurrency, options, etc.).
The calculation of the MACD indicator is as follows:
- MACD line: 12 daysEMA – 26 days EMA
- Signal line: 9 days EMA of the MACD line
- MACD Histogram: MACD line – Signal line.
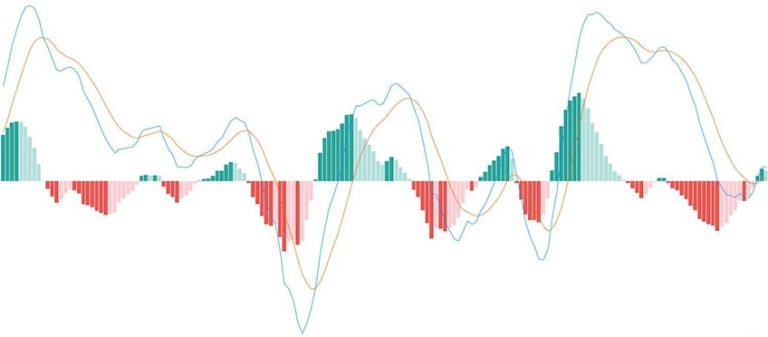
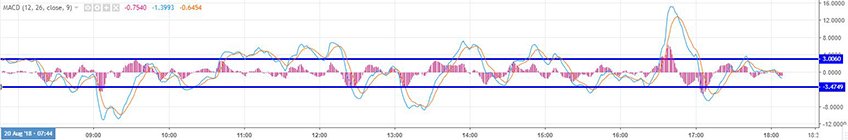
In the examples below, the blue line is the MACD line. The orange line is the signal line and the red candles form the histogram. The MACD line, the signal line and the histogram can be used for strategies.
Spot the trend
You can read the MACD indicator in a simple way as follows:
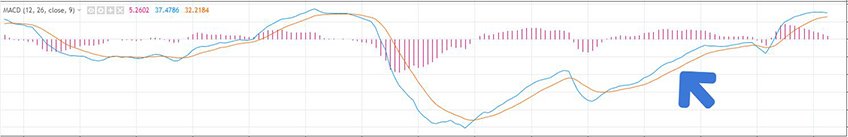
- In case of an upward trend, the signal line is below the MACD line.
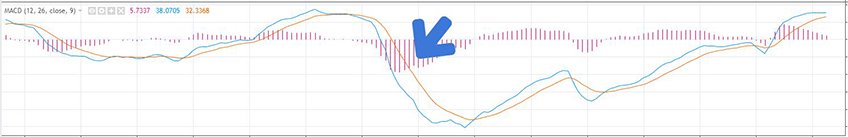
- In case of a downward trend, the signal line is above the MACD line.
Upward trend
Downward trend
Trading strategies with the MACD indicator
The MACD indicator can be used in many trading strategies. Below I’ll give you a few common examples you can immediately start working with yourself!
MACD crossover
As said above, you can see from the MACD indicator whether an effect is moving upwards or downwards. You then look at which line is the top line. With the MACD crossover strategy you use crossing the lines as a moment to go long or short.
In the image below, the green arrows are moments to go long and the red arrows indicate a moment to go short.
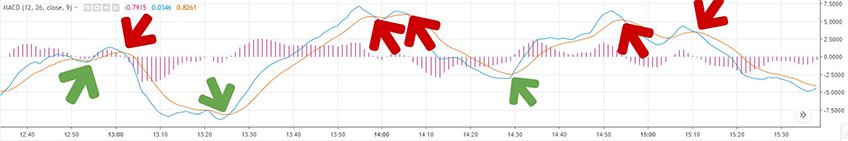
If you look closely, you see that the lines cross more often than buy and sell signals are given. As is the case with many indicators, it is wise to use a filter so that you don’t get false signals too often.
With this strategy you only go short if the two lines are above the 0-axis and only long if the two lines are below the 0-axis.
Overbought / Oversold
The MACD indicator is besides a trend indicator also a good indicator to see if an effect is overbought or oversold. Overbought means that the price of an effect has risen too fast lately. Oversold means exactly the opposite. If an effect is overbought or oversold then there is a good chance that the price will soon move in the other direction.
To use the MACD indicator to see if an effect is overbought or oversold, we use the histogram of the MACD indicator. We draw two lines within the histogram is normally located. The upper line indicates the range within the effect is rising and the lower line indicates the range within the effect is falling.
As can be seen in the picture above, the histogram is one time above the range that is normal for this effect. This upward movement is followed by a downward sharp movement. By using this as a trading signal we could have made a profit with a short position.
Divergence
You can also use the MACD indicator to see if the trend in which an effect is moving still has enough momentum. For example, a second top (in the price chart) in an uptrend with a lower signal line top, indicates that there is a bullish divergence. And a second bottom in a downtrend with a higher signal line bottom, indicates that there is a bearish divergence. It is best to explain both situations using an example:
Bullish divergence

Bearish divergence

As we can see in both pictures, the divergence is followed by a price movement in the opposite direction.
As with any other technical analysis strategy, a signal becomes stronger when a buy or sell signal is also given by another indicator or by the price itself.
 Stay Ahead in Crypto