
Introduction
TA is the abbreviation for Technical Analysis. Technical analysis focuses entirely on analyzing the price development of a security. When performing a TA, the underlying facts of a security are not taken into account (stocks, cryptocurrencies, options, etc.), but only the historical price.
Over the years, numerous strategies and indicators have been developed to predict the price development of a security.
There are two different types of technical analysis:
- Price Action
- Trading indicators
Price Action focuses on price development itself. By recognizing patterns in the course of the price, predictions are made.
Trading indicators are formed by making calculations based on the historical price.
Frequently used indicators:
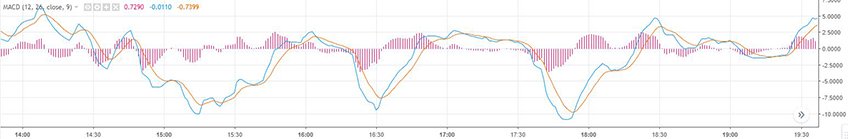
Moving Average Convergence Divergence (MACD)
MACD stands for Moving Average Convergence/Divercence and is a tool used by traders to see the trend of a price. The instrument consists of three parts. A twenty-six day exponential moving average (EMA), which is subtracted from a twelve day EMA. This calculation makes the MACD line. The third part is a nine day EMA of the MACD line. This last line is called the signal line. A commonly used strategy is, that as soon as the signal line breaks through the MACD line from below, a buy order is placed. As soon as the signal line breaks, the MACD line from top to bottom, a short order is placed.
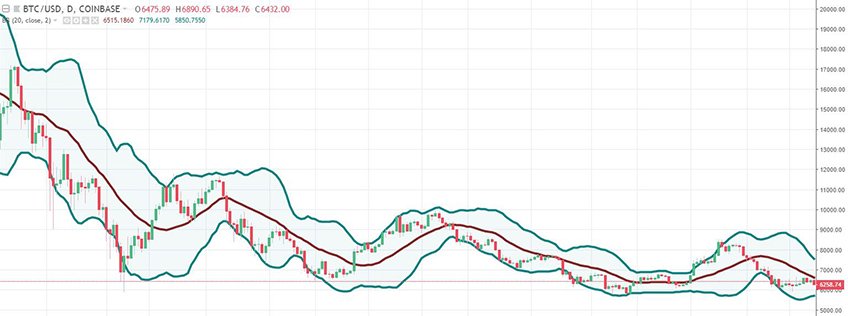
Bollinger Bands
Bollinger Bands consists of a Simple Moving Average (SMA) with two standard deviations. One standard deviation sits above the SMA and the other standard deviation is below the SMA. Bollinger Bands is a widely used indicator by both professional investors and beginners. Bollinger Bands can be used for both a trend and a range trading strategy.
Stochastic Oscillator
The Stochastic Oscillator was developed by George Lane in the late 50s. Bullish or bearish divergences can be predicted with the stochastic Oscillator. The Stochastic Oscillator also makes it clear at a glance whether an effect is overbought or oversold.
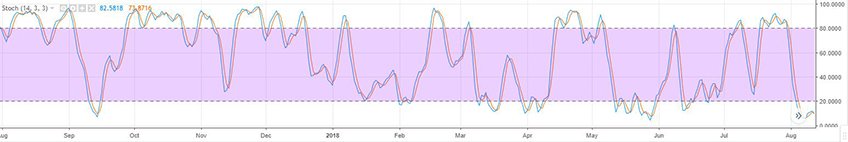
The Stochastic Oscillator consists of two lines. The main line is called the %K line and the second line is called the %D line. The %D line is a moving average (three periods) of the %K line. The two lines always move between 0 and 100. If the two lines move above the 80 limit, an effect is overbought. If an effect goes below the 20 boundary, it is oversold.
In the image below the blue line is the %K line and the orange line is the %D line.
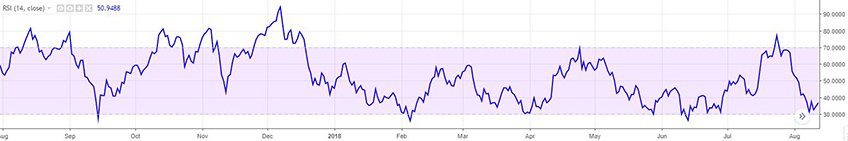
Relative Strength Index (RSI)
With the Relative Strength Index (RSI), it is easy to see whether an effect is overbought or oversold, just like with the Stochastic Oscillator. The RSI indicator measures the speed and direction of a price movement. If the line is above 70, then there is an overbought situation. If the line is below 30 then there is an oversold situation. However, some traders use 80 and 20 as upper and lower limits.
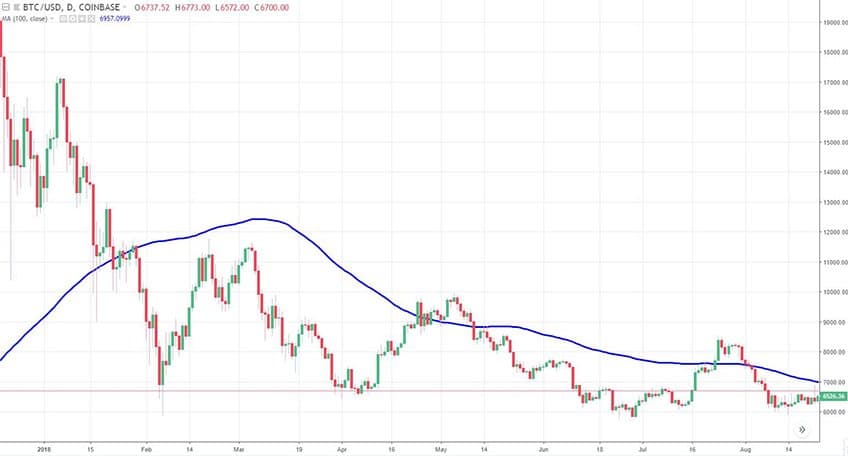
Simple Moving Average (SMA)
The Simple Moving Average (SMA) is the simplest indicator in this list. An SMA is a line that consists of the last closing prices divided by the number of periods. An SMA is the average price of a certain period. You can easily set how many periods you want the SMA to exist from. The lower the number of periods, the faster an SMA responds to a price change.
Commonly used strategies
SMA (Simple Moving Average) crossover
For the SMA crossover strategy, you need three different SMAs. A short SMA (e.g. 9), a medium SMA (e.g. 60), and a long SMA (e.g. 100). As soon as the short and medium SMA cross the long SMA from below, a buy signal occurs. If the opposite happens and the short and medium SMAs cross the long SMA from above, a sell signal occurs.
In the image below the green circles stand for moments to go long and the red circle for moments to go short.
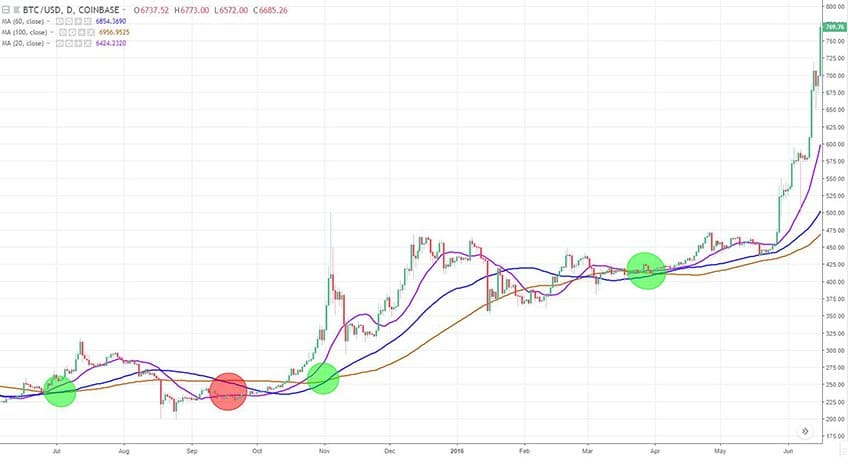
If we had used this strategy, we would have made a profit with the long trades and made a loss with the short trade.
As with any strategy you use, you never know for sure which direction the price is heading, therefore it is important to always set a ‘stop loss’. With this strategy you put your ‘stop loss’ just below the longest SMA (100) in case of a long position. The other way around, you put a ‘stop loss’ just above the longest SMA (100) in case of a short position.
Double bottom or double top strategy
The double bottom strategy is a price action strategy and therefore does not look at indicators, but only at the price of an effect.
The double bottom strategy can be used for an effect which is in a downward trend. You wait until the price makes a retracement and then drops again. If the price doesn’t fall any further than the previously formed bottom, this is a signal that the price might form a double bottom.
See the image below for an example:
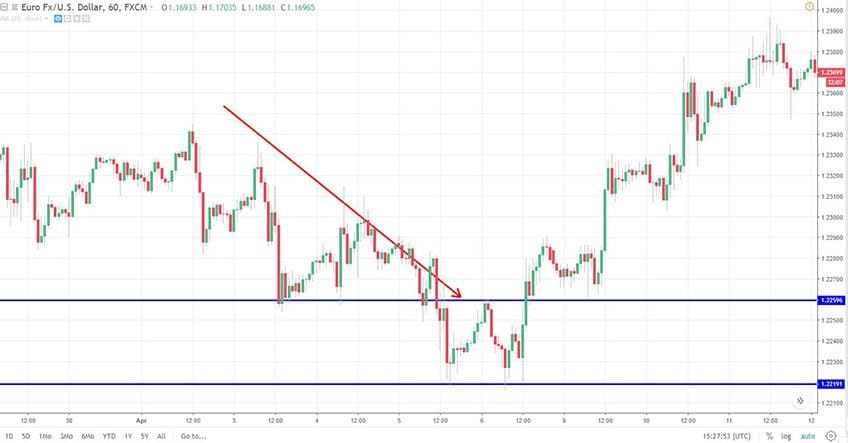
When the bottom is reached for the second time, you don’t take a position yet, but instead wait until the direction has broken the neck (the upper blue line). You can do this by setting an alert or by setting a ‘buy stop’ (if that’s possible with your trading software).
The moment you go long is at the green arrow:
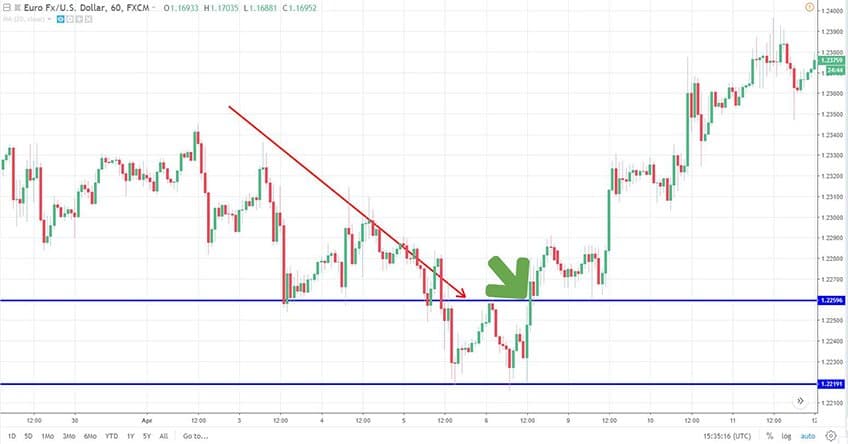
This strategy can also be used when an effect is in an upward trend. The whole strategy is then exactly the other way around.
De Bollinger bounce
The Bollinger bounce is a real range trading technique. Markets move most of the time between certain price levels, also called support and resistance levels. As a trader, you can make use of this by going long when a support level is reached and by going short when a resistance level is reached. You can calculate these resistance and support levels by drawing a horizontal line at the level of the last top and bottom, but also by using the Bollinger Bands. The Bollinger Bands form dynamic support and resistance levels.
The technique is quite easy to apply and works as follows: As soon as the price hits the upper band of the Bollinger Bands, you open a short position. As soon as the price hits the lower band of the Bollinger Bands you open a long position. Set the ‘stop loss’ to 50% of the range of the bands. So with a risk of 1 euro, you can earn about €2 per profitable trade (assuming the price remains in it’s range).
In the image below the green arrows are moments to go long and the red arrows moments to go short.
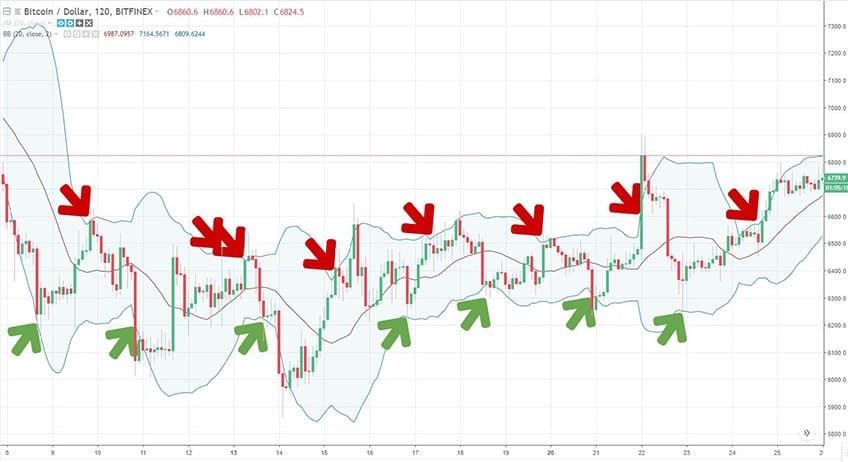
If you look closely, you see that the price touches the edges more often than we have taken a position. This is because the price must first have broken the middle line before you take a second short or long position. If you don’t follow this rule, you’ll get a lot of false signals and you can lose quite a lot as soon as the price starts to follow a trend upwards or downwards. You may even be able to tighten up this rule by never taking two identical positions at the same time.
Brakeout strategy
The breakout strategy is just like the double bottom strategy, a typical price action strategy. With the breakout strategy you look at which price level a price has trouble with. As soon as this price level is broken, you go long or short (depending on whether the price increases or decreases). You put the ‘stop loss’ rather tightly below the resistance level in case of a long position. If it’s a short position you’ll put the ‘stop loss’ just above the support level.
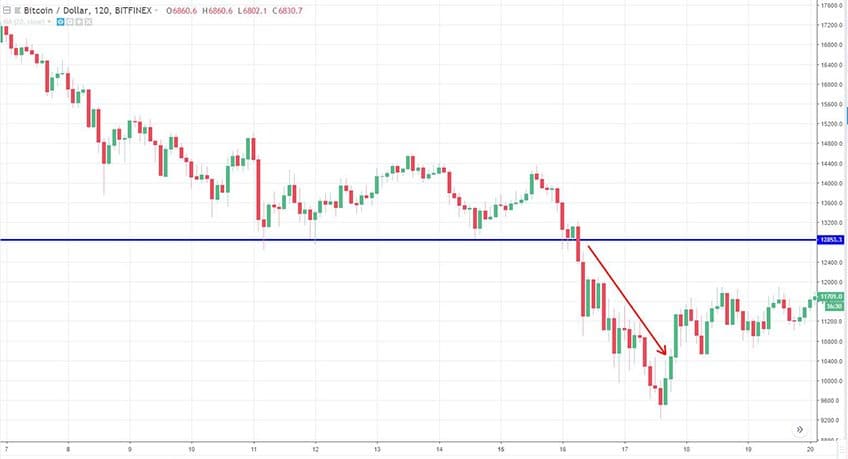
As you can see in the picture above, the price bounces three times back from the blue line. This is the sign that there is a support level there. As soon as the price breaks through, the support price drops down even more rapidly.
As soon as the price breaks through a support level (the blue line), it is possible that the price gets into an acceleration. This is because ‘stop loss’ levels of traders who are long are touched and thus they are forced to (automatically) sell their positions. This gives a lot of downward pressure. The opposite happens when the price breaks above a resistance level. At that moment short sellers will have to buy back their borrowed securities, creating upward pressure.
Where to trade?
If you’re ready to start trading now, it’s important to make informed decisions by choosing a reliable exchange. Before committing, be sure to check crypto exchange reviews to ensure the platform meets your needs and offers a secure trading environment. These reviews can provide valuable insights into fees, features, and user experiences, helping you make a good decision.
Enhancing Technical Analysis with a Reliable Trading VPS
Now that you’ve explored various technical analysis (TA) methods, the next step is ensuring your strategies can be executed efficiently. Whether you’re using moving averages, Bollinger Bands, or breakout strategies, speed and stability play a crucial role in applying these techniques in real-world trading.
A low-latency VPS can help traders automate their setups, run indicators continuously, and execute trades with minimal delay. By reducing execution time, a dedicated trading server ensures that price action strategies and indicator-based signals translate into timely and effective trades, particularly in fast-moving markets.
 Stay Ahead in Crypto