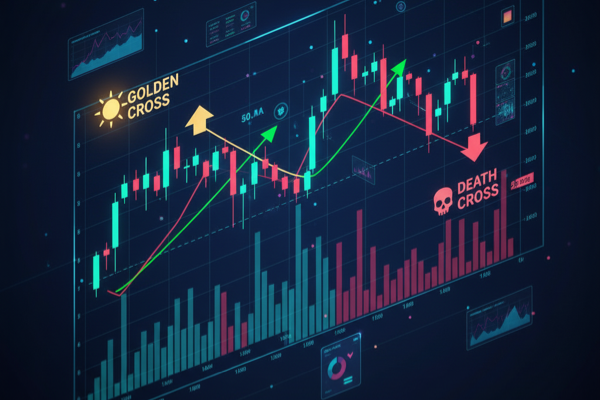
A Golden Cross and Death Cross are two widely used technical indicators in the world of trading. These indicators help traders make predictions about the market direction, specifically long-term trends. While a Golden Cross signals an upcoming bull market, a Death Cross indicates that a bear market might follow.
Both indicators are based on moving averages, which smooth out price data over a specific period to show trends. They represent the crossover between a short-term moving average and a long-term moving average. The crossover pattern is significant because it suggests potential trend reversals that traders use to decide when to buy or sell.
Golden Cross: The Bullish Indicator
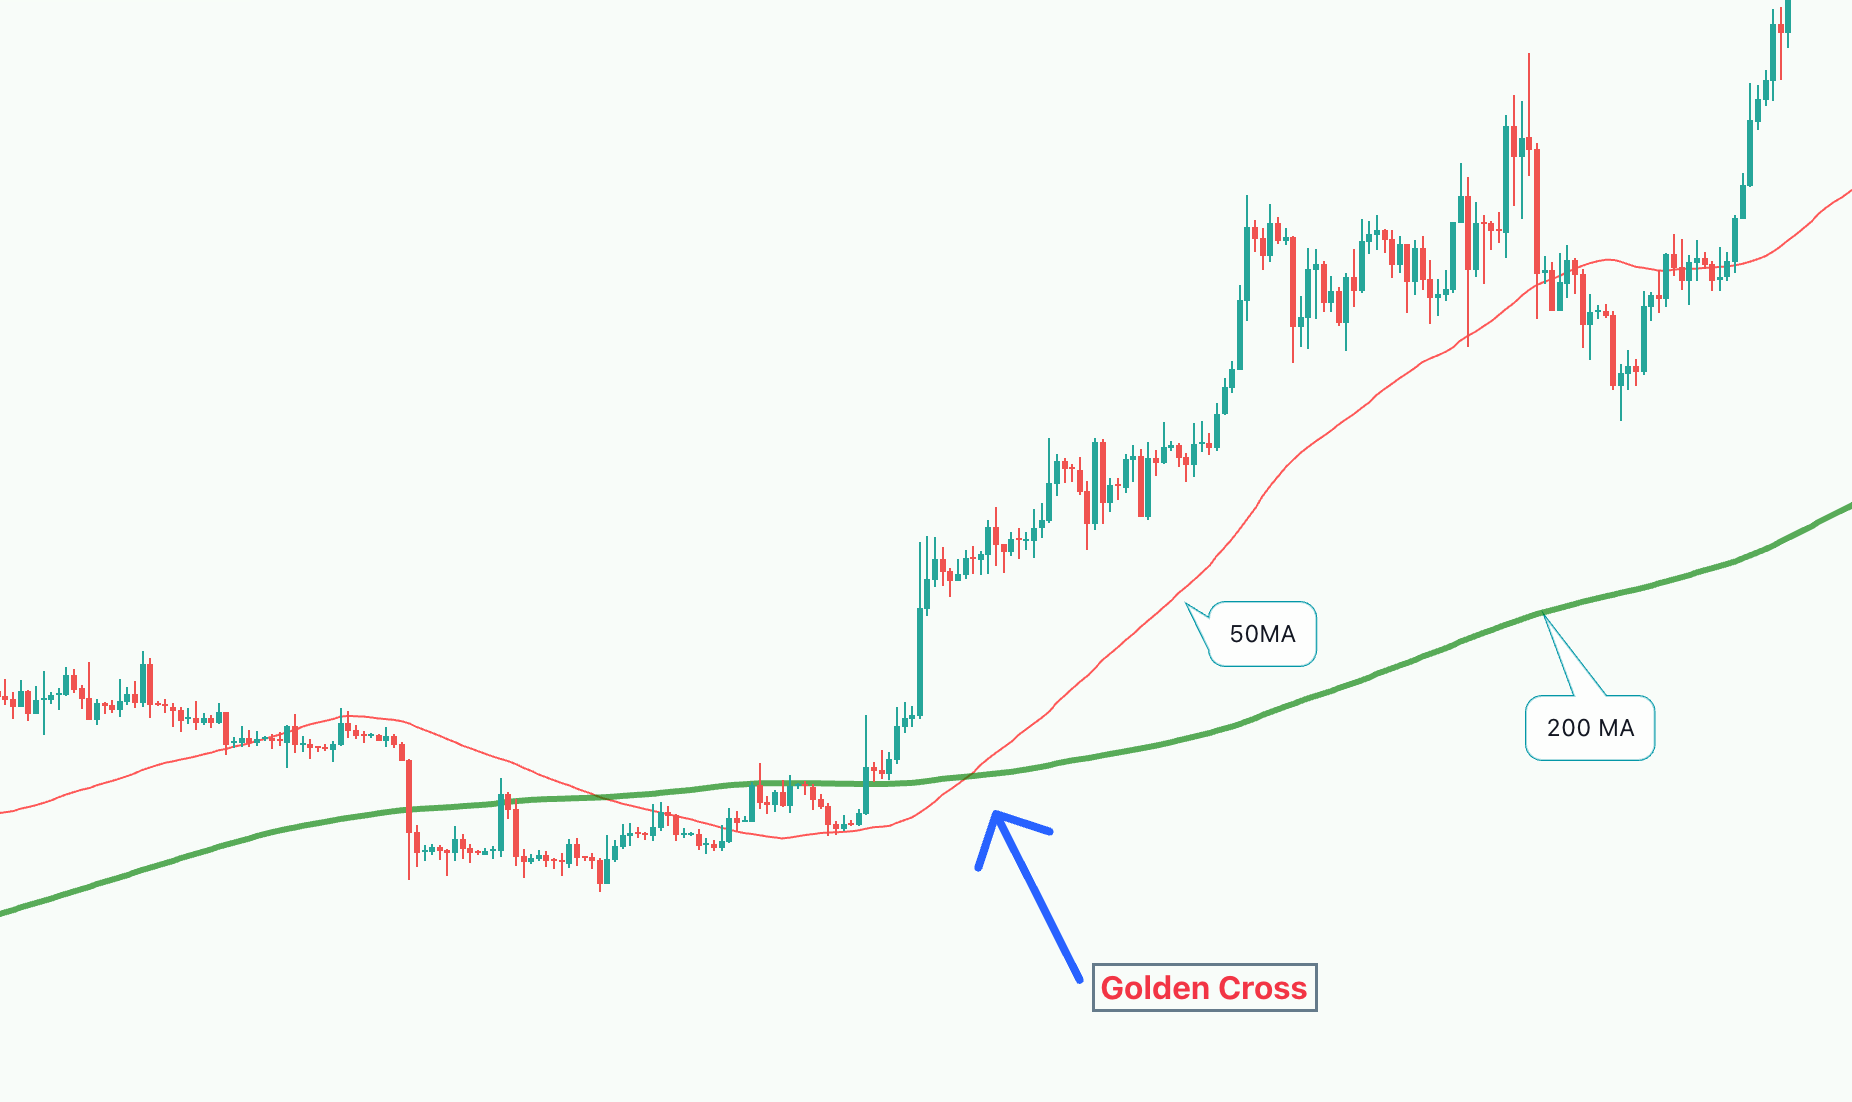
The Golden Cross is a bullish signal that occurs when a short-term moving average crosses above a long-term moving average. The most commonly used moving averages for this crossover are the 50-day moving average (MA) and the 200-day moving average. The crossover indicates that the market’s momentum is shifting to the upside.
When a Golden Cross forms, it often signals the beginning of a long-term upward trend. Traders typically interpret this as a sign to enter long positions or buy assets, expecting the price to continue rising. However, while the Golden Cross is a strong bullish indicator, it doesn’t guarantee that the market will maintain its upward trajectory indefinitely.
Key Characteristics of a Golden Cross:
- Occurs when the short-term moving average (e.g., 50-day MA) crosses above the long-term moving average (e.g., 200-day MA).
- Indicates a shift from a downtrend to an uptrend, suggesting increasing bullish sentiment.
- Commonly used in stocks, forex, and crypto markets to predict sustained upward momentum.
- Traders often see it as a sign to buy or hold, anticipating higher prices in the future.
Death Cross: The Bearish Indicator
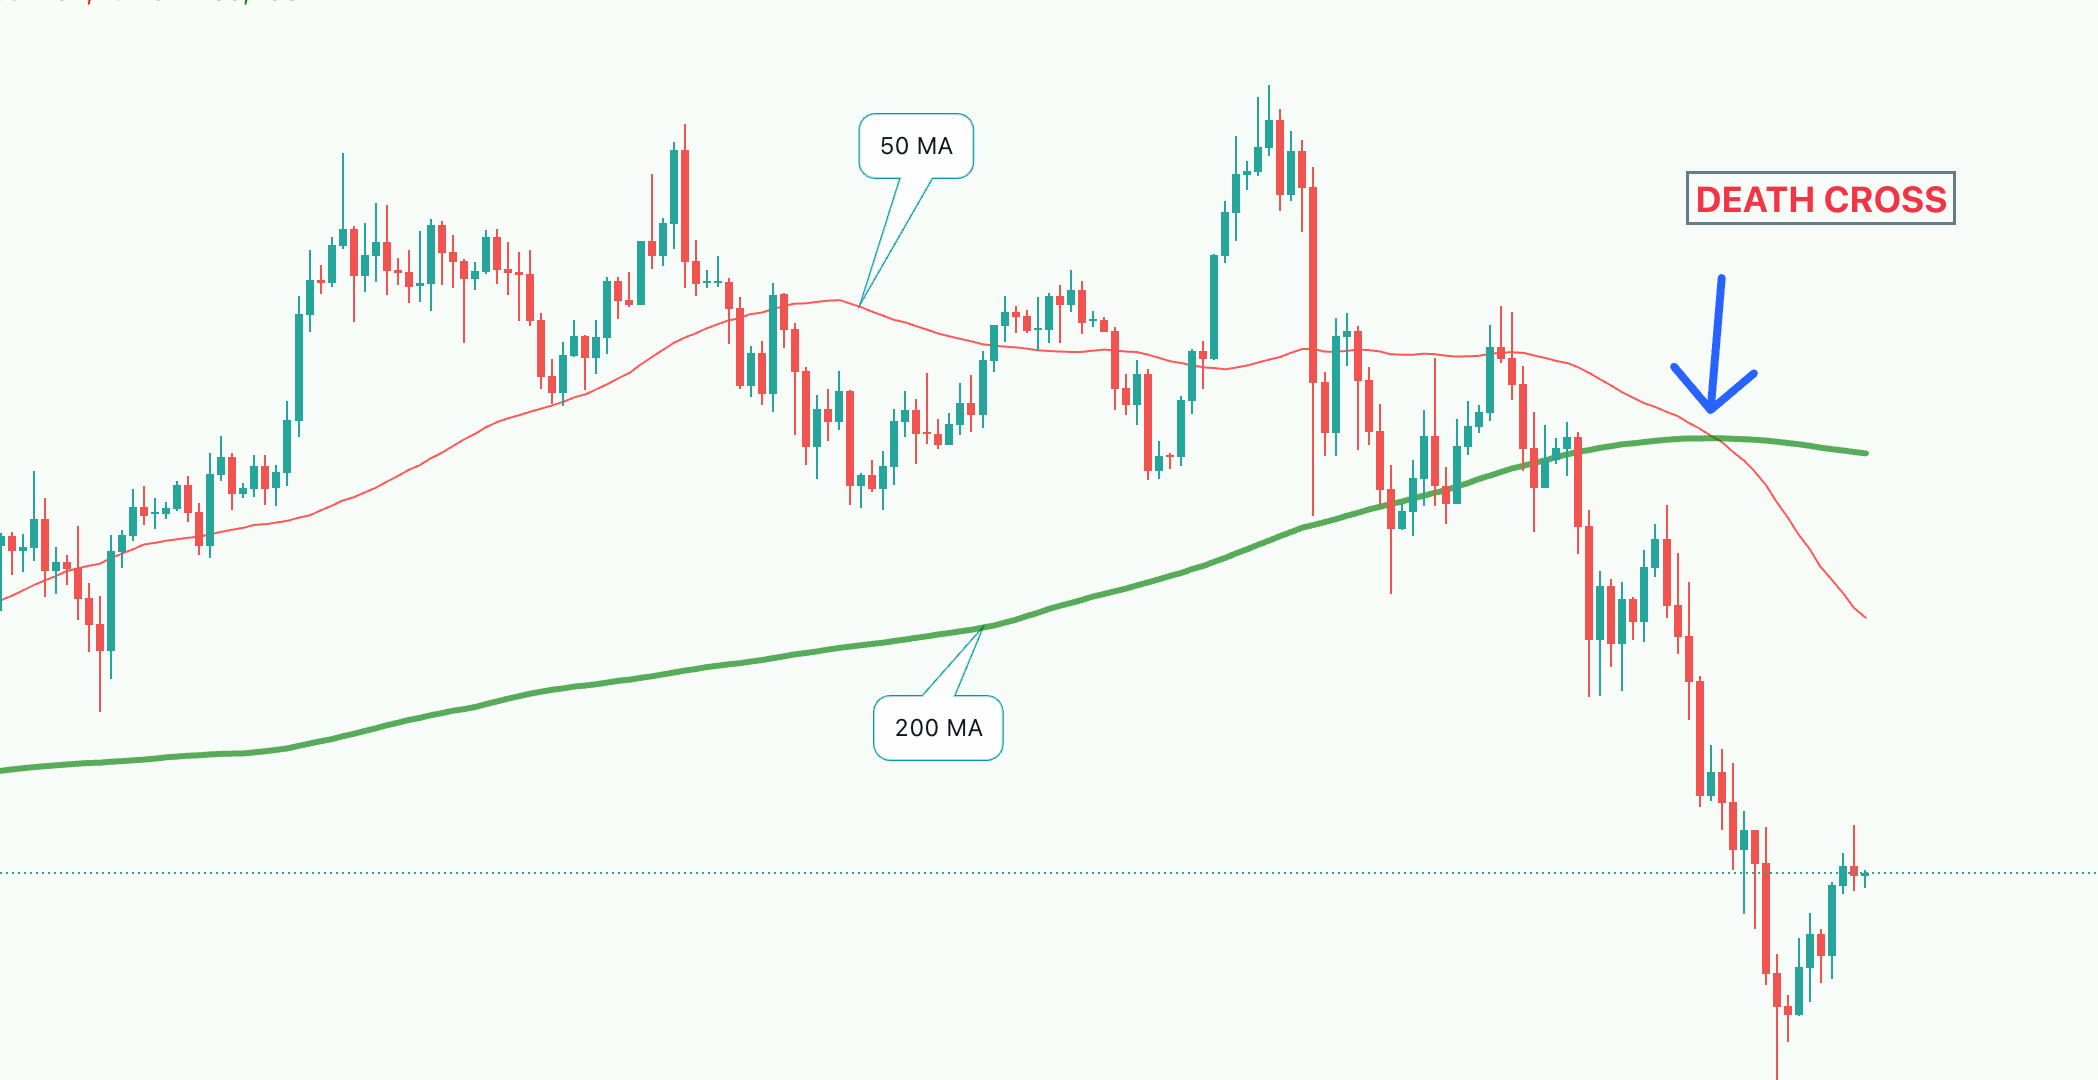
The Death Cross is the opposite of the Golden Cross and is considered a bearish signal. It occurs when a short-term moving average crosses below a long-term moving average. Typically, the 50-day MA crosses below the 200-day MA, which signals a potential downtrend in the market.
The Death Cross indicates that the market may be entering a long-term bear phase, where prices are likely to fall further. It is often seen as a sign for traders to sell or short assets, as the downtrend is expected to continue. However, like the Golden Cross, the Death Cross doesn’t guarantee that the market will stay bearish; markets can sometimes rebound or reverse after forming this pattern.
Key Characteristics of a Death Cross:
- Occurs when the short-term moving average (e.g., 50-day MA) crosses below the long-term moving average (e.g., 200-day MA).
- Indicates a shift from an uptrend to a downtrend, suggesting increasing bearish sentiment.
- Traders typically interpret it as a sign to sell or avoid buying, anticipating lower prices.
- It’s a popular signal used by traders to identify potential downtrends in markets like stocks, forex, and cryptocurrencies.
Importance of Volume in Confirming Crossovers
For both the Golden Cross and Death Cross, volume plays a crucial role in confirming the strength of the trend. High trading volume during these crossovers indicates that the market participants are actively backing the trend. Without volume confirmation, crossovers may be unreliable and lead to false signals.
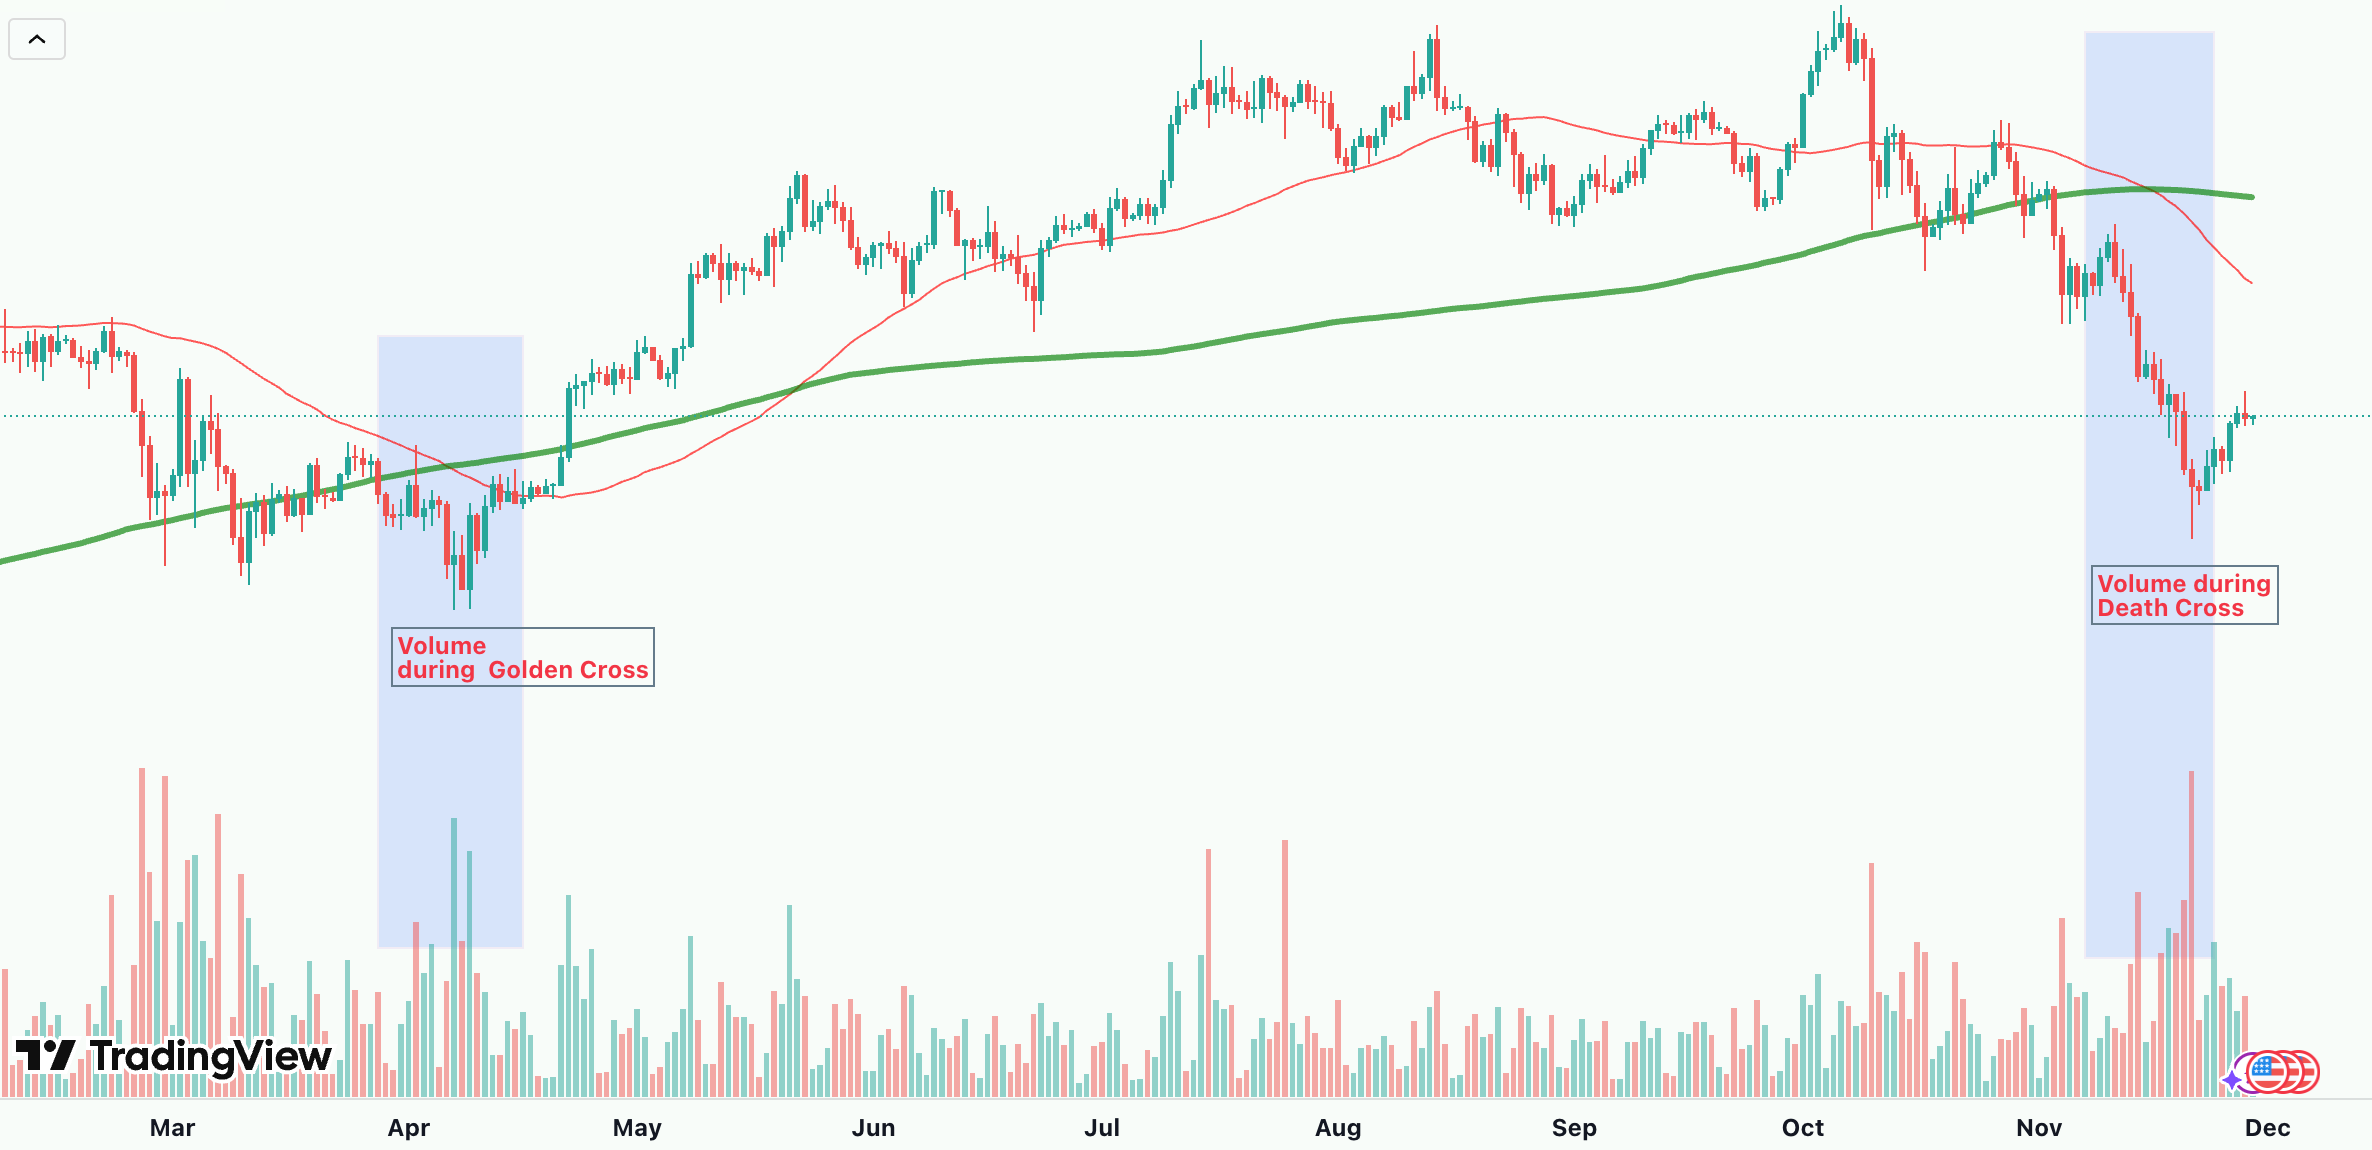
- Golden Cross: A Golden Cross is stronger when accompanied by high buying volume. This shows that there is significant investor interest, which supports the upward trend.
- Death Cross: Similarly, the Death Cross gains reliability when it is accompanied by high selling volume. This indicates that the bearish trend is likely to continue.
Time Frames for Golden Cross and Death Cross
Golden Crosses and Death Crosses are most reliable when used with long-term time frames, such as daily charts. The 50-day MA and 200-day MA are the most common moving averages used in these signals. However, traders can also apply these crossovers to shorter time frames for more frequent signals, though these are generally considered less reliable.
Time Frame Variations:
- Daily Chart: The 50-day and 200-day moving averages on a daily chart are the most commonly used for Golden and Death Crosses. These provide a clear view of long-term trends.
- Shorter Time Frames: Some traders apply the crossovers to shorter time frames (e.g., 5-minute or 15-minute charts) for day trading. However, these signals can be prone to more false positives due to market noise.
Golden Cross vs Death Cross: Which One is More Reliable?
While both the Golden Cross and Death Cross provide valuable insights into market trends, they are not foolproof. The key to their reliability lies in confirmation through additional indicators, such as RSI (Relative Strength Index) or MACD (Moving Average Convergence Divergence). Traders often use these indicators alongside the crossovers to confirm momentum.
- Golden Cross Reliability: The Golden Cross is often considered more reliable during sustained uptrends. However, if the market is volatile or consolidating, it may not lead to a long-term trend.
- Death Cross Reliability: The Death Cross is generally more reliable in strongly trending bear markets. In sideways markets, however, it can lead to false signals.
Using Golden and Death Crosses in Trading Strategies
Both the Golden Cross and Death Cross provide essential signals for traders, especially those focused on long-term trends. These indicators are primarily used to identify major market shifts, helping traders decide when to enter or exit positions. However, it is important to combine these crossovers with other technical indicators to confirm their reliability and avoid potential pitfalls.
For long-term investors, a Golden Cross may present a solid buying opportunity, while a Death Cross can signal a time to sell or short an asset. Regardless of which signal occurs, volume and other technical indicators should always be considered before making a trading decision.
Using Golden and Death Crosses in conjunction with other analysis tools can help traders make more informed decisions and navigate both bullish and bearish market phases with confidence.
 Stay Ahead in Crypto