Key Takeaways
- A bull flag is a continuation pattern that forms after a sharp rally, signaling a brief pause before the uptrend resumes.
- The pattern has three parts: a steep flagpole, a tight consolidation flag, and a breakout confirmed by rising volume.
- Traders enter on the breakout, set stops below the flag’s low, and target a move equal to the flagpole’s height.
In This Article
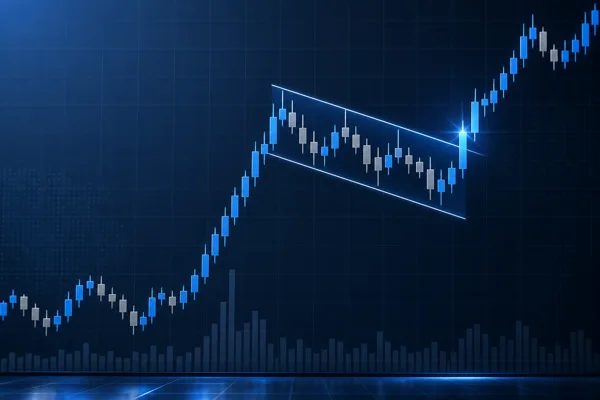
The bull flag pattern remains a favorite among traders for identifying short pauses during powerful market uptrends. It offers clear entry and exit points, making it reliable for both beginners and experienced investors.
What Is a Bull Flag Pattern?
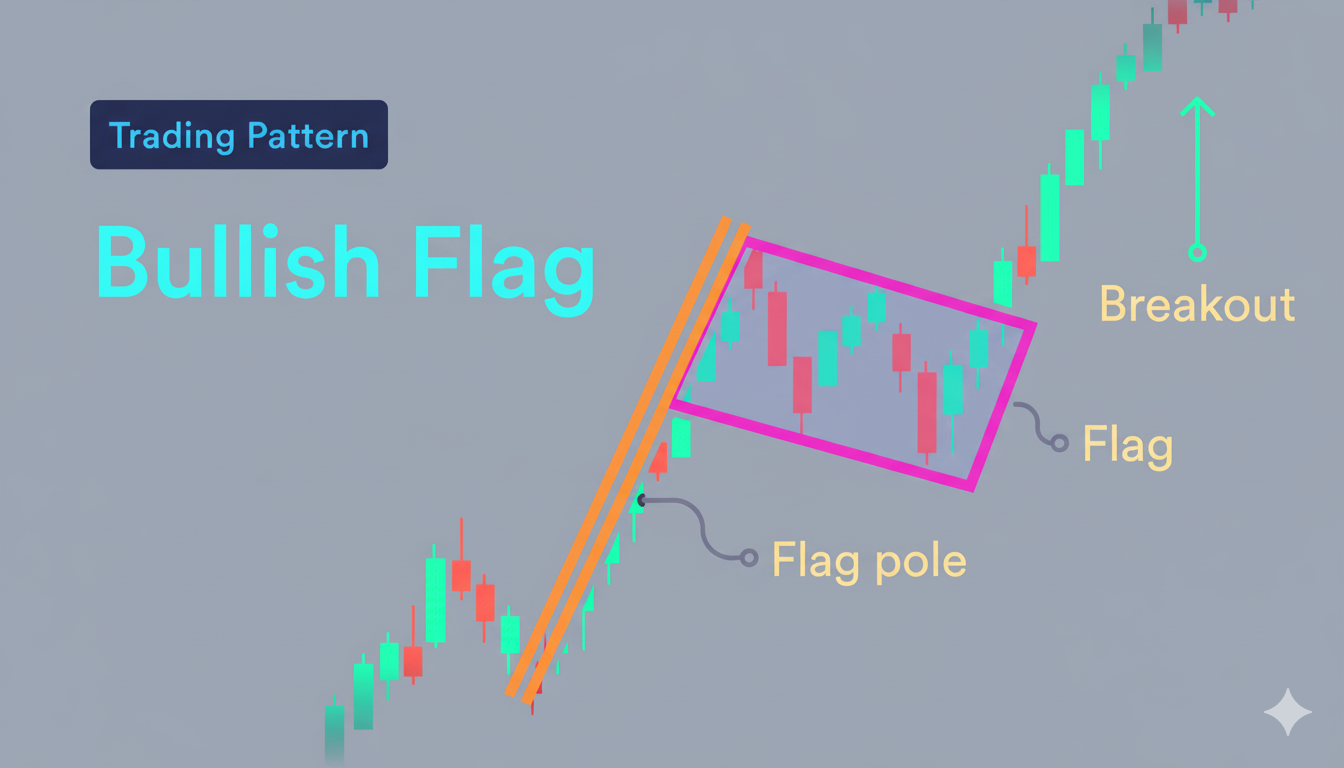
A bull flag is a continuation chart pattern that forms after a sharp price rise.
- The initial rise forms the flagpole.
- A brief consolidation or pullback forms the flag.
This consolidation shows temporary profit-taking while demand stays strong. When the price breaks above the flag’s upper boundary, the uptrend usually continues.
Structure and Market Psychology
The pattern reflects a short “rest” before the next bullish run.
- Flagpole: Represents the sharp rally driven by strong buying.
- Flag: Shows the market taking a short pause or minor correction.
- Breakout: Occurs when price pushes through resistance with rising volume.
During the flag’s formation, volume usually drops, showing reduced volatility. This pause is easy to recognize when trading from charts, as visual price structures clearly display momentum cooling before the next move. As the breakout starts, volume rises again, confirming renewed momentum.
Key Characteristics of a Bull Flag
A valid bull flag shares several identifiable traits:
- Retraces 20 to 50% of the flagpole.
- Has tight price action with overlapping candles.
- Forms over a short period relative to the initial rally.
- Breaks out on high volume, confirming buying strength.
Types of Bull Flags
Different markets and timeframes may produce slight variations:
- Classic Downward Flag: tilts slightly down, showing gentle profit-taking.
- Sideways Flag: moves horizontally, signaling balanced demand and supply.
- Bull Pennant: forms a small triangle as ranges narrow.
How to Trade the Bull Flag
Entry Strategy:
- Enter a trade when the price breaks above the upper flag boundary.
- Confirm the move with increased volume or strong candle closes.
Stop-Loss Placement:
- Place stops just below the flag’s low for protection.
- Tighter stops can be set within the flag for more active traders.
Profit Target:
- Measure the flagpole’s height and project it from the breakout point.
- For example, if the pole is $20 high, aim for a $20 move above breakout.
Volume Confirmation:
- Low volume inside the flag = healthy pause.
- Rising volume at breakout = strong continuation signal.
Common Mistakes to Avoid
- Trading random pullbacks that don’t form clear flags.
- Ignoring the strength or steepness of the flagpole.
- Entering before breakout confirmation.
- Overlooking volume patterns.
- Neglecting risk management or stop-loss discipline.
False Breakouts and When the Pattern Fails
Not every breakout from a bull flag follows through. A few signs the setup is failing:
- Breakout occurs on weak or below-average volume.
- Price closes back inside the flag within a candle or two.
- The flag retraces more than 50% of the flagpole, weakening the trend.
- Broader market sentiment shifts against the move just before breakout.
Waiting for a confirmed close above the flag boundary, paired with rising volume, filters out most false signals.
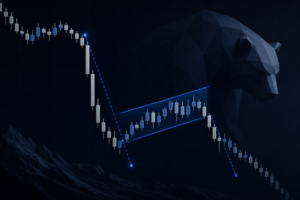
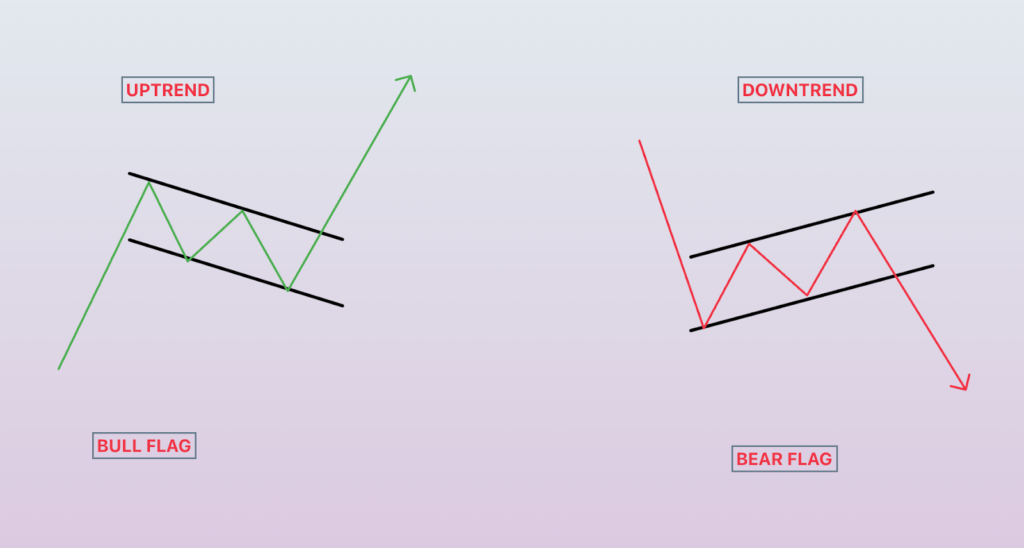
Bull Flag vs. Bear Flag
| Feature | Bull Flag | Bear Flag |
| Trend Direction | Upward | Downward |
| Breakout Direction | Above Resistance | Below Support |
| Psychology | Pause before continuation higher | Pause before continuation lower |
| Ideal Setup | Shallow pullback | Shallow rebound |
Quick Bull Flag Checklist
- Strong prior uptrend forms a clear flagpole.
- Price consolidates in a tight downward or sideways channel.
- Volume declines during consolidation.
- Breakout occurs with strong volume and a bullish candle close.
- Stop-loss placed under flag low; target equals flagpole height.
Momentum Continuation Pattern
The bull flag remains one of the most reliable continuation patterns in technical analysis, with a clean structure, clear confirmation signals, and adaptable use across timeframes. By contrast, the bear flag pattern operates on the same principles in downtrends, serving as its bearish counterpart. By focusing on volume, proportion, and disciplined risk control, traders can use flags, whether bullish or bearish, to capture trend continuations confidently.
 Stay Ahead in Crypto